Download
1 / 21
210 likes | 282 Views
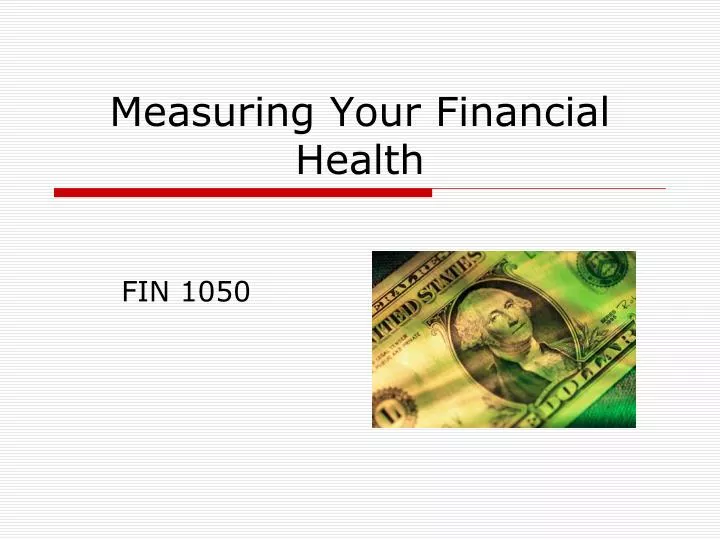
Measuring Your Financial Health. FIN 1050. What We Will Cover. Balance Sheet Income Statement Ratio Analysis. Nothing Happens Without a Plan. If you are like most people, you can probably spend money without thinking about it However, you can’t save money without thinking about it

E N D
Measuring Your Financial Health FIN 1050
What We Will Cover • Balance Sheet • Income Statement • Ratio Analysis
Nothing Happens Without a Plan • If you are like most people, you can probably spend money without thinking about it • However, you can’t save money without thinking about it • Planning and budgeting require self-control • The rewards are worth the sacrifices
Using a Balance Sheet to Measure Your Wealth • Before you can measure how much you need to save to reach a goal, you have to know • what you own (assets) • what you owe (your debts or liabilities) • The difference between assets and liabilities is net worth
Assets • Monetary assets: • Cash • Checking and savings accounts • Money market funds • Investments: • Stocks, bonds, mutual funds • Retirement Plans • IRAs, 401(k), Keogh plans, etc.
Assets, continued • Housing • If you own a house, it will probably hold the majority of your savings • Vehicles • Car, truck, motorcycle, etc. • Personal property • All of your possessions: furniture, appliances, jewelry, clothes, etc. • Other: anything else of value
Liabilities (Debts) • Current liabilities (those that must be paid off within one year): • Unpaid bills • Credit card debt • Long-Term Liabilities (debts to be paid off in longer than one year) • Mortgage • Car loans • Student loans
Net Worth (Wealth) • The difference between the total of assets and the total of liabilities • If liabilities are greater than assets, you are insolvent • The balance sheet shows your financial standing at a moment in time • It will change from month to month and year to year • If your net worth is going up over time, you are gaining wealth
Check out the balance sheet for Larry and Louise Tate on page 35-36. After reviewing expenses and spending patterns, you can set specific goals to cut back on spending and increase savings. This is a budget.
Income Statement • An income statement tells where your money has come from and where it has gone over a period of time • An income statement tells you whether you are earning more than you are spending
Income Statement, continued • See Figure 2.4 on page 38 for a simplified income statement • The formula for determining net income is: Total income – total expenses
Income • Income can include: • Wages • Bonuses • Tips • Commissions • Allowance • Gifts • Taxes must be subtracted from income
Expenses • Expenses are more difficult to track than income is • Sometimes you spend money without leaving a paper trail such as a credit card bill • Expenses can be divided into two categories: • Fixed expenses • Variable expenses
Fixed Expenses • Fixed expenses are expenses that you don’t have a lot of control over and that are the same every month: • Mortgage or rent • Car payment • Insurance premiums • Other loan payments
Variable Expenses • These are expenses that you have some control over: • Food • Clothing • Entertainment • Utilities • Medical expenses • Transportation
See Figure 2.5 on page 39: How American’s Spent Their Money in 2005 Taxes: 32% Housing: 17% Food: 8% Medical Care: 11.5%
See the Income Statement for Larry and Louise Tate on page 40-41.
Using Ratios: A Financial Thermometer • Ratios allow you to analyze raw data and compare them to a preset target or your own previous performance • Ratios answer these questions: • Do I have adequate liquidity to meet emergencies? • Do I have the ability to meet my debt obligations? • Am I saving as much as I think I am?
Monetary Assets Current Ratio= Current Liabilities Current Ratio • Do you have enough cash on hand to meet current obligations? (look for a number > 2) 3590 Current Ratio= = 2.39 1500
Debt Ratio • Do I have the ability to meet my debt obligations? (This should go down over time) Total Debt Debt Ratio = Total Assets 175,500 Debt Ratio = = .5846 or 58% 300,190 Just over half of the Tate’s assets are financed with borrowing
Savings Ratio • How much of your income are you really saving? Income available for savings Savings ratio= Income available for living expenses 4276 Savings ratio = = 7.6% 56,510