Download
1 / 30
300 likes | 509 Views
Summary of Previous Lecture. We covered the following topics; Payback period (PBP) method of project evaluation and selection, including its: (a) calculation; (b) acceptance criterion; (c) advantages and disadvantages; and (d) focus on liquidity rather than profitability.

E N D
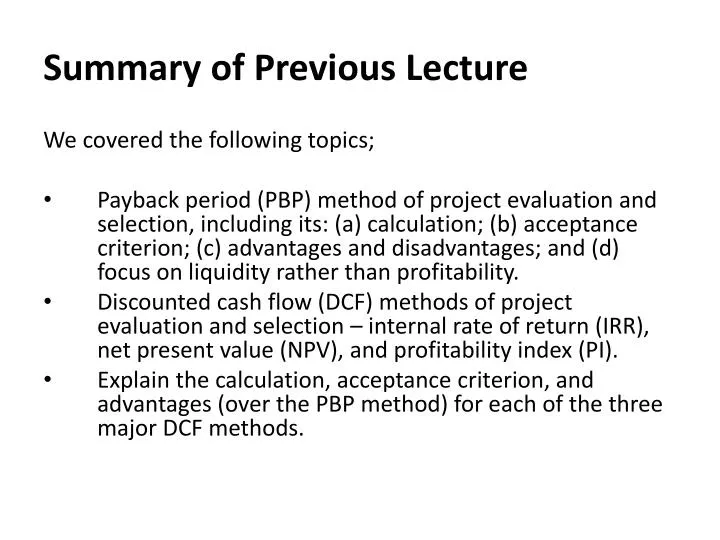
Summary of Previous Lecture We covered the following topics; • Payback period (PBP) method of project evaluation and selection, including its: (a) calculation; (b) acceptance criterion; (c) advantages and disadvantages; and (d) focus on liquidity rather than profitability. • Discounted cash flow (DCF) methods of project evaluation and selection – internal rate of return (IRR), net present value (NPV), and profitability index (PI). • Explain the calculation, acceptance criterion, and advantages (over the PBP method) for each of the three major DCF methods.
Chapter 13 (II) Capital Budgeting Techniques
Learning Outcomes After studying Chapter 13, you should be able to: • Understand the payback period (PBP) method of project evaluation and selection, including its: (a) calculation; (b) acceptance criterion; (c) advantages and disadvantages; and (d) focus on liquidity rather than profitability. • Understand the three major discounted cash flow (DCF) methods of project evaluation and selection – internal rate of return (IRR), net present value (NPV), and profitability index (PI). • Explain the calculation, acceptance criterion, and advantages (over the PBP method) for each of the three major DCF methods. • Define, construct, and interpret a graph called an “NPV profile.” • Understand why ranking project proposals on the basis of IRR, NPV, and PI methods “may” lead to conflicts in ranking. • Describe the situations where ranking projects may be necessary and justify when to use either IRR, NPV, or PI rankings. • Understand how “sensitivity analysis” allows us to challenge the single-point input estimates used in traditional capital budgeting analysis. • Explain the role and process of project monitoring, including “progress reviews” and “post-completion audits.”
Other Project Relationships Dependent(or Contingent) - A project whose acceptance depends on the acceptance of one or more other projects. For example, construction of new building for the new machinery to be installed. Mutually Exclusive - A project whose acceptance precludes the acceptance of one or more alternative projects. For example if the firm is considering purchasing a truck from two available options.
A. Scale of Investment B. Cash-flow Pattern C. Project Life Potential Problems under mutual exclusive projects; ranking of proposals using DCF methods may produce contradictory results in the form of; Ranking Problems
Compare a small (S) and a large (L) project. A. Scale Differences NET CASH FLOWS END OF YEAR Project S Project L 0 -$100 -$100,000 1 0 0 2 $400 $156,250
Calculate the PBP, IRR, NPV@10%, and PI@10%. Which project is preferred? Why? ProjectIRRNPVPI S 100% $231 3.31 L 25% $29,132 1.29 Scale Differences
Ranking the S and L Projects Rankings IRR NPV at 10% PI at 10% 1st Project S L S 2nd Project L S L In terms of absolute dollar terms Project L is superior where as DCF techniques may also suggest otherwise.
Let us compare a decreasing cash-flow (D) project and an increasing cash-flow (I) project. B. Cash Flow Pattern NET CASH FLOWS END OF YEAR Project D Project I 0 -$1,200 -$1,200 1 1,000 100 2 500 600 3 100 1,080
D 23% $198 1.17 I 17% $198 1.17 Calculate the IRR, NPV@10%, and PI@10%. Which project is preferred? IRR for the D and I are 23 % and 17% respectively. ProjectIRRNPVPI Cash Flow Pattern
Examine NPV Profiles Plot NPV for each project at various discount rates. Project I NPV@10% Net Present Value ($) -200 0 200 400 600 IRR Project D 0 5 10 15 20 25 Discount Rate (%)
Fisher’s Rate of Intersection At k<10%, I is best! Fisher’s Rate of Intersection Net Present Value ($) -200 0 200 400 600 At k>10%, D is best! 0 5 1015 20 25 Discount Rate ($)
Ranking the D and I Projects K<10% K>10% Rankings IRR NPV PI NPV PI 1st Project D I I D D 2nd Project I D D I I Remember that initial cash outflow and life of the project are identical for projects D and I.
Let us compare a long life (X) project and a short life (Y) project. C. Project Life Differences NET CASH FLOWS Project X Project Y END OF YEAR 0 -$1,000 -$1,000 1 0 2,000 2 0 0 3 3,375 0
X 50% $1,536 2.54 Y 100% $ 818 1.82 Calculate the IRR, NPV@10%, and PI@10%. Which project is preferred? Why? ProjectIRRNPVPI Project Life Differences
Ranking the X and Y Projects Rankings IRR NPV at 10% PI at 10% 1st Project Y X X 2nd Project X Y Y Project Y”s IRR is twice that of project X with same ICO, I case Project X CF starts after 3 years whereas Project Y provides all CF in just one year and can be capitalized for future ventures. Choice of project should consider the addition of greatest absolute increment in the value of firm.
Another Way to Look at Things • Adjust cash flows to a common terminal year if project “Y” will not be replaced. Compound Project Y, Year 1 @10% for 2 years. Year 0 1 2 3 CF -$1,000 $0 $0 $2,420 Results: IRR* = 34.26% NPV = $818 Lower IRR from adjusted cash-flow stream. X is still Best.
Replacing Projects with Identical Projects 2. Use Replacement Chain Approach when project “Y” will be replaced. 0 1 2 3 -$1,000 $2,000 -1,000 $2,000 -1,000 $2,000 -$1,000 $1,000 $1,000 $2,000 Results: IRR = 100% NPV* = $2,238.17 *Higher NPV, but the same IRR. Y is Best.
Capital Rationing Capital Rationing occurs when a constraint (or budget ceiling) is placed on the total size of capital expenditures during a particular period. For example a budget ceiling on investment projects where the firms have a policy of internally financing capital expenditures. Example: Mr. A from AB Corporation (ABC) must determine what investment opportunities to undertake for ABC. He is limited to a maximum expenditure of $32,500 only for this capital budgeting period.
A $ 500 18% $ 50 1.10 B5,000 25 6,500 2.30 C 5,000 37 5,500 2.10 D 7,500 20 5,000 1.67 E 12,500 26 500 1.04 F 15,000 28 21,000 2.40 G 17,500 19 7,500 1.43 H 25,000 15 6,000 1.24 Available Projects for ABC Project ICO IRR NPV PI
C $ 5,000 37% $ 5,500 2.10 F 15,000 2821,000 2.40 E 12,500 26500 1.04 27000 B5,000 25 6,500 2.30 Projects C, F, and E have the three largest IRRs. The resulting increase in shareholder wealth is $27,000 with a $32,500 outlay. Choosing by IRRs for ABC Project ICO IRR NPV PI
F $15,000 28% $21,000 2.40 G 17,500 19 7,500 1.43 B 5,000 25 6,500 2.30 28500 Projects F and G have the two largest NPVs. The resulting increase in shareholder wealth is $28,500 with a $32,500 outlay. Choosing by NPVs for ABC Project ICO IRR NPV PI
F $15,000 28% $21,000 2.40 B 5,000 25 6,500 2.30 C 5,000 37 5,500 2.10 D 7,500 20 5,000 1.67 38000 G 17,500 19 7,500 1.43 Projects F, B, C, and D have the four largest PIs. The resulting increase in shareholder wealth is $38,000 with a $32,500 outlay. Choosing by PIs for ABC Project ICO IRR NPV PI
MethodProjects AcceptedValue Added PI F, B, C, and D $38,000 NPV F and G $28,500 IRR C, F, and E $27,000 PI generates the greatest increase in shareholder wealth when a limited capital budget exists for a single period. Summary of Comparison
Allows us to change from “single-point” (i.e., changes in revenue, installation cost, final salvage, etc.) estimates to a “what if” analysis Utilize a “base-case” to compare the impact of individual variable changes E.g., Change forecasted sales units to see impact on the project’s NPV Sensitivity Analysis: A type of “what-if” uncertainty analysis in which variables or assumptions are changed from a base case in order to determine their impact on a project’s measured results (such as NPV or IRR). Single-Point Estimate and Sensitivity Analysis
Post-completion Audit A formal comparison of the actual costs and benefits of a project with original estimates. Identify any project weaknesses Develop a possible set of corrective actions Provide appropriate feedback Result: Making better future decisions! Post-Completion Audit
Two; There are as many potential IRRs as there are sign changes. Let us assume the following cash flow pattern for a project for Years 0 to 4: -$100 +$100 +$900 -$1,000 How many potential IRRs could this project have? Multiple IRR Problem*
Multiple IRR Problem NPV Periods Cash Flows 12.95% 50% 191.15%
NPV Profile -- Multiple IRRs 75 Multiple IRRs at k = 12.95% and 191.15% 50 Net Present Value ($000s) 25 0 -100 0 40 80 120 160 200 Discount Rate (%)
Summary • Understand why ranking project proposals on the basis of IRR, NPV, and PI methods “may” lead to conflicts in ranking. • Describe the situations where ranking projects may be necessary and justify when to use either IRR, NPV, or PI rankings. • Understand how “sensitivity analysis” allows us to challenge the single-point input estimates used in traditional capital budgeting analysis. • Explain the role and process of project monitoring, including “progress reviews” and “post-completion audits.”