Download
1 / 48
480 likes | 767 Views
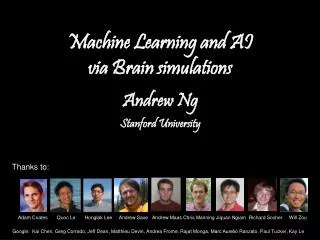
Introduction to Machine Learning BMI/IBGP 730 . Kun Huang Department of Biomedical Informatics The Ohio State University. Machine Learning Statistical learning Artificial intelligence Pattern recognition Data mining. Machine Learning Supervised Unsupervised Semi-supervised

E N D
Introduction to Machine LearningBMI/IBGP 730 Kun Huang Department of Biomedical Informatics The Ohio State University
Machine Learning • Statistical learning • Artificial intelligence • Pattern recognition • Data mining
Machine Learning • Supervised • Unsupervised • Semi-supervised • Regression
Clustering and Classification • Preprocessing • Distance measures • Popular algorithms (not necessarily the best ones) • More sophisticated ones • Evaluation • Data mining
Clustering or classification? • Is training data available? • What domain specific knowledge can be applied? • What preprocessing of data is needed? • Log / data scale and numerical stability • Filtering / denoising • Nonlinear kernel • Feature selection (do I need to use all the data?) • Is the dimensionality of the data too high?
Testing sample Prediction error Training sample Model complexity (reproduced from Hastie et.al.) • Accuracy vs. generality • Overfitting • Model selection
How do we process microarray data (clustering)? • Feature selection – genes, transformations of expression levels. • Genes discovered in the class comparison (t-test). Risk: missing genes. • Iterative approach : select genes under different p-value cutoff, then select the one with good performance using cross-validation. • Principal components (pro and con). • Discriminant analysis (e.g., LDA).
Dimensionality Reduction • Principal component analysis (PCA) • Singular value decomposition (SVD) • Karhunen-Loevetransform (KLT) Basis for P SVD
Principal Component Analysis (PCA) - Other things to consider • Numerical balance/data normalization • Noisy direction • Continuous vs. discrete data • Principal components are orthogonal to each other, however, biological data are not • Principal components are linear combinations of original data • Prior knowledge is important • PCA is not clustering!
Visualization of Microarray Data • Multidimensional scaling (MDS) • High-dimensional coordinates unknown • Distances between the points are known • The distance may not be Euclidean, but the embedding maintains the distance in a Euclidean space • Try different dimensions (from one to ???) • At each dimension, perform optimal embedding to minimize embedding error • Plot embedding error (residue) vs. dimension • Pick the knee point
Visualization of Microarray Data Multidimensional scaling (MDS)
Distance Measure (Metric?) • What do you mean by “similar”? • Euclidean • Uncentered correlation • Pearson correlation
Distance Metric • Euclidean 102123_at Lip1 1596.000 2040.900 1277.000 4090.500 1357.600 1039.200 1387.300 3189.000 1321.300 2164.400 868.600 185.300 266.400 2527.800 160552_at Ap1s1 4144.400 3986.900 3083.100 6105.900 3245.800 4468.400 7295.000 5410.900 3162.100 4100.900 4603.200 6066.200 5505.800 5702.700 dE(Lip1, Ap1s1) = 12883
Distance Metric • Pearson Correlation 102123_at Lip1 1596.000 2040.900 1277.000 4090.500 1357.600 1039.200 1387.300 3189.000 1321.300 2164.400 868.600 185.300 266.400 2527.800 160552_at Ap1s1 4144.400 3986.900 3083.100 6105.900 3245.800 4468.400 7295.000 5410.900 3162.100 4100.900 4603.200 6066.200 5505.800 5702.700 dP(Lip1, Ap1s1) = 0.904
Distance Metric • Pearson Correlation Ranges from 1 to -1. r = 1 r = -1
Distance Metric • Uncentered Correlation 102123_at Lip1 1596.000 2040.900 1277.000 4090.500 1357.600 1039.200 1387.300 3189.000 1321.300 2164.400 868.600 185.300 266.400 2527.800 160552_at Ap1s1 4144.400 3986.900 3083.100 6105.900 3245.800 4468.400 7295.000 5410.900 3162.100 4100.900 4603.200 6066.200 5505.800 5702.700 du(Lip1, Ap1s1) = 0.835 q About 33.4o
Distance Metric • Difference between Pearson correlation and uncentered correlation 102123_at Lip1 1596.000 2040.900 1277.000 4090.500 1357.600 1039.200 1387.300 3189.000 1321.300 2164.400 868.600 185.300 266.400 2527.800 160552_at Ap1s1 4144.400 3986.900 3083.100 6105.900 3245.800 4468.400 7295.000 5410.900 3162.100 4100.900 4603.200 6066.200 5505.800 5702.700 Uncentered correlation All are considered signals Pearson correlation Baseline expression possible
Distance Metric • Difference between Euclidean and correlation
Distance Metric • PCC means similarity, how can we transform it to distance? • 1-PCC • Negative correlation may also mean “close” in signal pathway (1-|PCC|, 1-PCC^2)
Supervised Learning • Perceptron – neural networks
Supervised Learning • Perceptron – neural networks
Supervised Learning • Support vector machines (SVM) and Kernels • Only (binary) classifier, no data model
Prior prob. Conditional prob. • Supervised Learning - Naïve Bayesian classifier • Bayes rule • Maximum a posterior (MAP)
B 2.0 1.5 1.0 0.5 . . . . . . . . . . . . . . . w A 0.5 1.0 1.5 2.0 Dimensionality reduction: linear discriminant analysis (LDA) (From S. Wu’s website)
B 2.0 1.5 1.0 0.5 . . . . . . . . . A . . . . 0.5 1.0 1.5 2.0 . . w Linear Discriminant Analysis (From S. Wu’s website)
Supervised Learning - Support vector machines (SVM) and Kernels • Kernel – nonlinear mapping
How do we use microarray? • Profiling • Clustering Cluster to detect gene clusters and regulatory networks Cluster to detect patient subgroups
How do we process microarray data (clustering)? • Unsupervised Learning – Hierarchical Clustering
How do we process microarray data (clustering)? • Unsupervised Learning – Hierarchical Clustering Single linkage: The linking distance is the minimum distance between two clusters.
How do we process microarray data (clustering)? • Unsupervised Learning – Hierarchical Clustering Complete linkage: The linking distance is the maximum distance between two clusters.
How do we process microarray data (clustering)? • Unsupervised Learning – Hierarchical Clustering • Average linkage/UPGMA: The linking distance is the average of all pair-wise distances between members of the two clusters. Since all genes and samples carry equal weight, the linkage is an Unweighted Pair Group Method with Arithmetic Means (UPGMA).
How do we process microarray data (clustering)? • Unsupervised Learning – Hierarchical Clustering • Single linkage – Prone to chaining and sensitive to noise • Complete linkage – Tends to produce compact clusters • Average linkage – Sensitive to distance metric
Unsupervised Learning – Hierarchical Clustering • Dendrograms • Distance – the height each horizontal line represents the distance between the two groups it merges. • Order – Opensource R uses the convention that the tighter clusters are on the left. Others proposed to use expression values, loci on chromosomes, and other ranking criteria.
Unsupervised Learning - K-means • Vector quantization • K-D trees • Need to try different K, sensitive to initialization
Unsupervised Learning - K-means [cidx, ctrs] = kmeans(yeastvalueshighexp, 4, 'dist', 'corr', 'rep',20); Metric K
Unsupervised Learning - K-means • Number of class K needs to be specified • Does not always converge • Sensitive to initialization
Unsupervised Learning • Self-organized maps (SOM) • Neural network based method • Originally used as a visualization method for visualize (embedding) high-dimensional data • Also related vector quantization • The idea is to map close data points to the same discrete level
Issues • Lack of consistency or representative features (5.3 TP53 + 0.8 PTEN doesn’t make sense) • Data structure is missing • Not robust to outliers and noise D’Haeseleer 2005 Nat. Biotechnol 23(12):1499-501
Model-based clustering methods (Han) http://www.cs.umd.edu/~bhhan/research2.html Pan et al. Genome Biology 2002 3:research0009.1 doi:10.1186/gb-2002-3-2-research0009
Data Mining is searching for knowledge in data • Knowledge mining from databases • Knowledge extraction • Data/pattern analysis • Data dredging • Knowledge Discovery in Databases (KDD)
The process of discovery Interactive + Iterative Scalable approaches
Popular Data Mining Techniques • Clustering: Most dominant technique in use for gene expression analysis in particular and bioinformatics in general. • Partition data into groups of similarity • Classification: • Supervised version of clustering technique to model class membership can subsequently classify unseen data. • Frequent Pattern Analysis • A method for identifying frequently re-curring patterns (structural and transactional). • Temporal/Sequence Analysis • Model temporal data wavelets, FFT etc. • Statistical Methods • Regression, Discriminant analysis
Summary • A good clustering method will produce high quality clusters with • high intra-class similarity • low inter-class similarity • The quality of a clustering result depends on both the similarity measure used by the method and its implementation. • Other metrics include: density, information entropy, statistical variance, radius/diameter • The quality of a clustering method is also measured by its ability to discover some or all of the hidden patterns.
Recommended Literature 1. Bioinformatics – The Machine Learning Approach by P. Baldi & S. Brunak, 2nd edition, The MIT Press, 2001 2. Data Mining – Concepts and Techniques by J. Han & M. Kamber, Morgan Kaufmann Publishers, 2001 3. Pattern Classification by R. Duda, P. Hart and D. Stork, 2nd edition, John Wiley & Sons, 2001 4. The Elements of Statistical Learning by T. Hastie, R. Tibshirani, J. Friedman, Springer-Verlag, 2001