Download
1 / 16
180 likes | 292 Views
Digital Image Processing Course. Histogram Specification. Dr . Gullanar M Hadi. Histogram Specification. Histogram equalization (HE) may not always provide the desired effect, since its goal fixed to distribute the gray-level values as evenly as possible

E N D
Digital Image Processing Course Histogram Specification Dr . Gullanar M Hadi
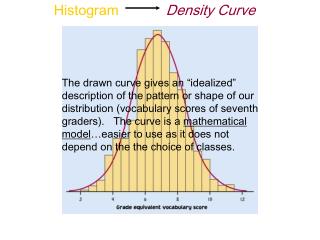
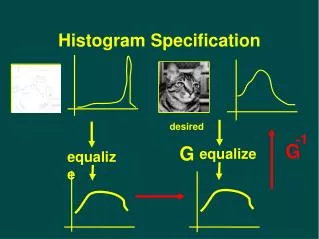
Histogram Specification • Histogram equalization(HE) may not always provide the desired effect, since its goal fixed to distribute the gray-level values as evenly as possible • Histogram Specification (HS) is the process of defining a histogram and modifying the histogram of the original image to match the histogram as specified.
The key concept in the HS process is to picture the original image being histogram equalized, and the specified histogram being histogram equalized. • This process can be implemented as in these steps: • Specify the desired histogram • Find the mapping table to histogram equalize the image, (Mapping Table 1) • Find the mapping table to histogram equalize the values of the specified histogram (Mapping Table 2) • Use Mapping Table 1 and Mapping Table 2 to find the Mapping Table to map the original values to the histogram equalized values and then to the specified histogram values • Use the table from step IV to map the original values to the specified histogram values Note do not round histogram equalized values to nearest integer until final mapping table to avoid ambiguities
desired 0.3 0.3 0.2 0.2 0.1 0.1 0 1 4 6 7 0 1 4 6 7 2 3 5 2 3 5 0 – 0.0 1 – 0.0 2 – 0.0 3 – 0.15 4 – 0.20 5 – 0.30 6 – 0.20 7 – 0.15 0 – 0.19 1 – 0.25 2 – 0.21 3 – 0.16 4 – 0.08 5 – 0.06 6 – 0.03 7 – 0.02 1.0 1.0 0.8 0.8 0.6 0.6 0.4 0.4 0.2 0.2 0.0 0.0 0 1 4 6 7 2 3 5 0 1 4 6 7 2 3 5
equalized histogram 0.3 0.3 0.2 0.2 0.1 0.1 r s 1 0 0 1 4 6 7 2 3 5 7 1.0 6 0.8 5 0.6 4 3 0.4 2 0.2 1 0.0 0 0 1 4 6 7 2 3 5
equalized histogram 0.3 0.3 0.3 0.2 0.2 0.2 0.1 0.1 0.1 r s 1 0 0 1 4 6 7 2 3 5 1 3 7 1.0 6 0.8 5 0.6 4 3 0.4 2 0.2 1 0.0 0 0 1 4 6 7 2 3 5
equalized histogram 0.3 0.3 0.3 0.2 0.2 0.2 0.1 0.1 0.1 r s 1 0 0 1 4 6 7 2 3 5 1 3 5 2 7 1.0 6 0.8 5 0.6 4 3 0.4 2 0.2 1 0.0 0 0 1 4 6 7 2 3 5
equalized histogram 0.3 0.3 0.3 0.2 0.2 0.2 0.1 0.1 0.1 r s 1 0 0 1 4 6 7 2 3 5 1 3 5 2 7 1.0 6 3 6 0.8 5 0.6 4 3 0.4 2 0.2 1 0.0 0 0 1 4 6 7 2 3 5
equalized histogram 0.3 0.3 0.3 0.2 0.2 0.2 0.1 0.1 0.1 r s 1 0 0 1 4 6 7 2 3 5 1 3 5 2 7 1.0 6 3 6 0.8 5 0.6 4 6 4 3 0.4 2 0.2 1 0.0 0 0 1 4 6 7 2 3 5
equalized histogram 0.3 0.3 0.3 0.2 0.2 0.2 0.1 0.1 0.1 r s 1 0 0 1 4 6 7 2 3 5 1 3 5 2 7 1.0 6 3 6 0.8 5 0.6 4 6 4 3 0.4 5 7 2 0.2 1 0.0 0 0 1 4 6 7 2 3 5
equalized histogram 0.3 0.3 0.3 0.2 0.2 0.2 0.1 0.1 0.1 r s 1 0 0 1 4 6 7 2 3 5 1 3 5 2 7 1.0 6 3 6 0.8 5 0.6 4 6 4 3 0.4 5 7 2 0.2 1 7 6 0.0 0 0 1 4 6 7 2 3 5
equalized histogram 0.3 0.3 0.3 0.2 0.2 0.2 0.1 0.1 0.1 r s 1 0 0 1 4 6 7 2 3 5 0 1 4 6 7 2 3 5 1 3 5 2 7 1.0 6 3 6 0.8 5 0.6 4 6 4 3 0.4 5 7 2 0.2 1 7 6 0.0 0 7 7 0 1 4 6 7 2 3 5
equalized histogram 0.3 0.3 0.3 0.2 0.2 0.2 0.1 0.1 0.1 r s 1 0 0 1 4 6 7 2 3 5 0 1 4 6 7 2 3 5 1 3 1 = 0.19 3 = 0.25 5 = 0.21 6 = .16+.08=.24 7 = .06+.03+.02 = 0.11 5 2 7 1.0 6 3 6 0.8 5 0.6 4 6 4 3 0.4 5 7 2 0.2 1 7 6 0.0 0 7 7 0 1 4 6 7 2 3 5
desired equalized histogram 0.3 0.3 0.2 0.2 0.1 0.1 r s 0 0 0 1 4 6 7 0 2 3 5 1 0 1 4 6 7 2 3 5 2 0 7 1.0 3 1 6 0.8 2 4 5 0.6 4 4 5 3 0.4 2 0.2 6 6 1 0.0 7 7 0 0 1 4 6 7 2 3 5
equalized orig resultant histogram 1 0 3 0.3 1 0.3 3 4 5 2 0.2 5 0.2 3 6 6 0.1 0.1 6 4 6 5 7 7 0 1 4 6 7 2 3 5 7 7 6 0 1 4 6 7 2 3 5 7 7 7 7 1.0 0.3 6 0.8 0.2 5 0.6 4 3 0.4 0.1 2 0.2 1 0.0 0 desired 0 1 4 6 7 2 3 5 0 1 4 6 7 2 3 5
HW Suppose that you given the following tables of an image histogram and a specified histogram, find the mapping tables and the resulting histogram after histogram process is performed.