Download

1 / 20
200 likes | 309 Views
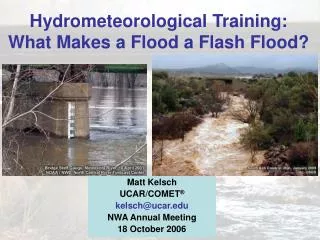
Flash Flood Fatality Frequency in Texas Counties. Specializing in Geospatial Analysis San Marcos, Texas. Introduction. Potential Consequences Property, Economic, Agricultural Production Losses Impact Welfare of Communities Loss of Life Increased Population Growth & Development =

E N D
Flash Flood Fatality Frequencyin Texas Counties Specializing in Geospatial Analysis San Marcos, Texas
Introduction • Potential Consequences • Property, Economic, Agricultural Production Losses • Impact Welfare of Communities • Loss of Life Increased Population Growth & Development = Increased Risk International Flash Flood Laboratory (IFFL) James and Marilyn Lovell Center for Geographic Education and Hazards Research Texas State University – San Marcos Department of Geography
Objectives – Problem Statement • Spatial distribution flash flood fatalities in Texas counties • Any existing patterns • Areas of vulnerability • Correlation to event damages and population growth • Variables that characterize those most likely to be at risk • Play an integral role in enhancing the establishment of the IFFL.
Data – Flash Flood Fatality Database • SHELDUS – Hazards Research Laboratory, University of South Carolina • Start/End Date • Injuries & Deaths • Property & Crop Damage • NCDC Storm Data Reports • Narrative description of event • National Weather Service
Data – GIS Analysis • Texas Water Development Board (TWDB) • Major Rivers • Terrain • Texas Natural Resource Information System (TNRIS) • Texas Counties • Texas State Data Center (TSDC) • Population Growth Maps
Methodology: Flash Flood Fatality Database SHELDUS Search – At least 1 Fatality + Cross-referenced with NCDC Storm Data • Additional Variables • Demographics: Age & Gender • Type of Incident Death • Latitude/Longitude or Other Location Information
Methodology – GIS Analysis • Data Layers Imported • Fatality Data → County Layer: Keyboard Entry • Newly Created Attribute Fields: • FAT_TOT • FAT_1990 • FAT_2000 • PROP_TOT • CROP_TOT • Maps created
Results – Flash Flood Fatality Totals Total Fatalities: 182 1990s: 82 2000s: 100
Population Growth vs. Distribution Produced by Texas State Data Center
Population Growth vs. Distribution Produced by Texas State Data Center
Website http://geo-305575.evans.txstate.edu
Variables Indicating Risk • Males < 20 or 60+ years of age • Vehicles • Elevation Changes – Balcones Escarpment • Close Proximity to Rivers • High Population Growth
Discussion • Frequency varies from year to year • Fatality/Event Decrease • Awareness Programs target specific groups • Possible Explanation – Road System • Rural Areas Surrounding Urban Centers
Limitations • Lack of accurate and complete data • Exact geographic locations • Standardized reporting method needed • Time Constraints Hindered Confidence in Results
Implications • Improved means of public education • Integral role in establishing IFFL • Foundation – One small step • Improved understanding of the magnitude, pattern and circumstances
Future Research • Development of a more comprehensive & complete database • Expand Variables Examined • Ethnicity • Income Levels • Stream Density • Floodplain Overlap • Flood Control Structures • Role of Infrastructure & Development • Public Perceptions of Flood Danger & Risk
Questions? Thank You