Download
1 / 9
90 likes | 176 Views
NSF / AERONOMY : SCIENCE HIGHLGHTS 2009. Waves caused by tsunamis can affect the upper atmosphere Michael Hickey, Embry-Riddle Aeronautical U. Richard Walterscheid, The Aerospace Corp. Gerald Schubert, UCLA. First Direct Observation of Micrometeoroid Differential Ablation

E N D
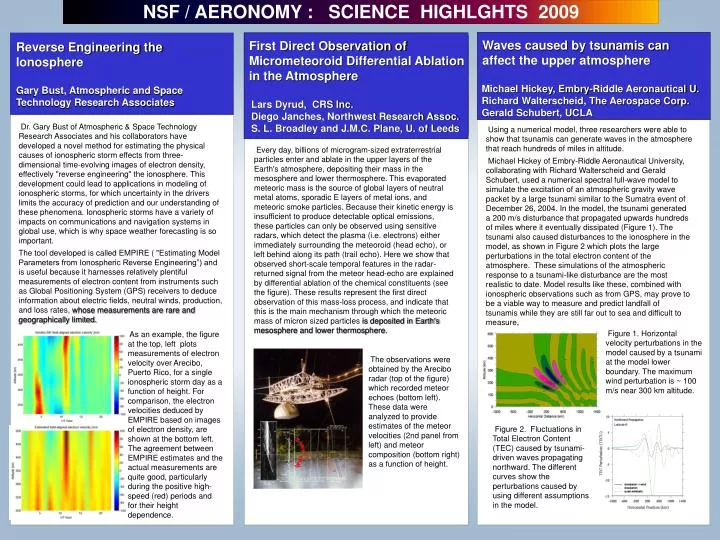
NSF / AERONOMY : SCIENCE HIGHLGHTS 2009 Waves caused by tsunamis can affect the upper atmosphere Michael Hickey, Embry-Riddle Aeronautical U. Richard Walterscheid, The Aerospace Corp. Gerald Schubert, UCLA First Direct Observation of Micrometeoroid Differential Ablation in the Atmosphere Lars Dyrud, CRS Inc. Diego Janches, Northwest Research Assoc. S. L. Broadley and J.M.C. Plane, U. of Leeds Reverse Engineering the Ionosphere Gary Bust, Atmospheric and Space Technology Research Associates Dr. Gary Bust of Atmospheric & Space Technology Research Associates and his collaborators have developed a novel method for estimating the physical causes of ionospheric storm effects from three-dimensional time-evolving images of electron density, effectively "reverse engineering" the ionosphere. This development could lead to applications in modeling of ionospheric storms, for which uncertainty in the drivers limits the accuracy of prediction and our understanding of these phenomena. Ionospheric storms have a variety of impacts on communications and navigation systems in global use, which is why space weather forecasting is so important. The tool developed is called EMPIRE ( "Estimating Model Parameters from Ionospheric Reverse Engineering”) and is useful because it harnesses relatively plentiful measurements of electron content from instruments such as Global Positioning System (GPS) receivers to deduce information about electric fields, neutral winds, production, and loss rates, whose measurements are rare and geographically limited. Using a numerical model, three researchers were able to show that tsunamis can generate waves in the atmosphere that reach hundreds of miles in altitude. Michael Hickey of Embry-Riddle Aeronautical University, collaborating with Richard Walterscheid and Gerald Schubert, used a numerical spectral full-wave model to simulate the excitation of an atmospheric gravity wave packet by a large tsunami similar to the Sumatra event of December 26, 2004. In the model, the tsunami generated a 200 m/s disturbance that propagated upwards hundreds of miles where it eventually dissipated (Figure 1). The tsunami also caused disturbances to the ionosphere in the model, as shown in Figure 2 which plots the large perturbations in the total electron content of the atmosphere. These simulations of the atmospheric response to a tsunami-like disturbance are the most realistic to date. Model results like these, combined with ionospheric observations such as from GPS, may prove to be a viable way to measure and predict landfall of tsunamis while they are still far out to sea and difficult to measure. Every day, billions of microgram-sized extraterrestrial particles enter and ablate in the upper layers of the Earth's atmosphere, depositing their mass in the mesosphere and lower thermosphere. This evaporated meteoric mass is the source of global layers of neutral metal atoms, sporadic E layers of metal ions, and meteoric smoke particles. Because their kinetic energy is insufficient to produce detectable optical emissions, these particles can only be observed using sensitive radars, which detect the plasma (i.e. electrons) either immediately surrounding the meteoroid (head echo), or left behind along its path (trail echo). Here we show that observed short-scale temporal features in the radar-returned signal from the meteor head-echo are explained by differential ablation of the chemical constituents (see the figure). These results represent the first direct observation of this mass-loss process, and indicate that this is the main mechanism through which the meteoric mass of micron sized particles is deposited in Earth's mesosphere and lower thermosphere. Figure 1.Horizontal velocity perturbations in the model caused by a tsunami at the model lower boundary. The maximum wind perturbation is ~ 100 m/s near 300 km altitude. As an example, the figure at the top, left plots measurements of electron velocity over Arecibo, Puerto Rico, for a single ionospheric storm day as a function of height. For comparison, the electron velocities deduced by EMPIRE based on images of electron density, are shown at the bottom left. The agreement between EMPIRE estimates and the actual measurements are quite good, particularly during the positive high-speed (red) periods and for their height dependence. The observations were obtained by the Arecibo radar (top of the figure) which recorded meteor echoes (bottom left). These data were analyzed to provide estimates of the meteor velocities (2nd panel from left) and meteor composition (bottom right) as a function of height. Figure 2.Fluctuations in Total Electron Content (TEC) caused by tsunami-driven waves propagating northward. The different curves show the perturbations caused by using different assumptions in the model.
NSF / AERONOMY : SCIENCE HIGHLGHTS 2009 International Symposium on Equatorial Aeronomy Erhan Kudeki and Jonathan Makela, University of Illinois at Urbana-Champaign Uncovering the mechanisms for lightning Paul Krehbiel, New Mexico Tech U., Jeremy Riousset and Victor Pasko, The Pennsylvania State University A New and Better Method of Measuring Winds in the Upper Atmosphere Meers Oppenheim, Boston University Dave Hysell, Cornell University At 60 miles above the ground, winds sometimes exceed 350 miles per hour. At this same altitude, objects entering the atmosphere become ferociously hot, the northern lights shine, tides slosh around, atmospheric waves break, and intense currents circulate. In order to understand and model this atmospheric region, researchers need accurate measurements. Over the past six decades, more than 400 rockets were launched to measure winds between 85 and 110 km altitude. Prof. Meers Oppenheim of Boston University and colleagues have developed a new method of measuring wind velocity profiles between 93 km and 110 km by tracking meteor trails as they are blown around by the upper atmosphere winds. Using a large radar (see Fig 1) they were able to measure wind velocities with unprecedented resolution. As shown in figure 2, winds speeds can exceed 150m/s and sometimes change by as much as 100m/s over a 6 km altitude range. This method should enable scientists to monitor the winds on a nearly continuous basis between midnight and dawn, something which has not been possible before. The 12th International Symposium on Equatorial Aeronomy (ISEA-12) was hosted by the Ionospheric Physics Lab at the Department of Physics, University of Crete from 18 to 24 May 2008 on the island of Crete, Greece. ISEA-12 was attended by 170 participants from 25 countries. The National Science Foundation provided financial support for many of the students and young scientists attending the meeting. A total of 250 papers (150 oral and 100 posters) were presented by invited and contributing authors in 11 scientific sessions. The topics covered a wide range of research, reflecting the need to study the Earth's ionosphere/atmosphere system in a coupled sense. ISEA-12 included sessions on the dynamics of the middle atmosphere, mesosphere, and thermosphere, E and F region plasma physics and ionospheric electrodynamics, large scale ionospheric modeling and simulation, atmosphere-ionosphere coupling processes and phenomena, magnetic storm and space weather effects, and a session on new experimental techniques and instruments. In addition, and for the first time in its long history, ISEA-12 started with a full day of tutorials on key topics given by leading members of the aeronomic community, and ended with a session of invited expert talks on future research trends and unresolved problems. The works of the symposium, the program, and the abstracts, are included in the ISEA-12 Book of Abstracts, which is available for download at the symposium's web page http://isea12.physics.uoc.gr . The mechanism behind different types of lightning may now be understood, thanks to a combination of direct observation and computer modeling reported by a team of researchers from New Mexico Tech and Penn State. About 90 percent of lightning occurs inside clouds and is not visible to the casual observer. Occasionally upward discharges appear, called blue jets and gigantic jets, that propagate out of the storm top toward or up to the ionosphere. Perhaps the most dangerous are "bolts from the blue" - lightning that begins upward, but then moves sideways and downward to hit the ground as much as three miles from a thunderstorm (see the figure). Whereas the intracloud and cloud-to-ground lightning is reasonably well understood, the cause and nature of upward discharges remains somewhat of a mystery. Detailed pictures of "bolts from the blue" were obtained using New Mexico Tech's Lightning Mapping Array, a three-dimensional lightning location system. These images were used to develop a model at Penn State that explained the variety of lightning types. The type of lightning depends on where charge builds up in a cloud and where imbalance in charges occurs. The height of the clouds helps determine whether a gigantic jet or bolt from the blue develops. The higher the top of the cloud, the more likely a gigantic jet will appear. The study gives a unifying view of how lightning escapes from a thundercloud and provides a set of predictions which can be tested by further observations. The work was reported in the April 2008 issue of Nature Geoscience where it was featured on the cover. Figure 2. Winds speeds determined from two 20-30 minute data samples Figure 1. The radar at Jicamarca Radio Observatory detecting a meteor trail. Photo credit: H. E. Edens Group photo of attendees at the ISEA-12 meeting.
NSF / AERONOMY : SCIENCE HIGHLGHTS 2009 Balloons over Africa Mike Combi, U. of Michigan Multi-Resolution Ionosphere Modeling: Investigating the Structure of the Equatorial Anomaly Dieter Bilitza, George Mason U. C.K. Shum, Ohio State U. Workshop on Coupling Thunderstorms and Lightning Discharges to Near-Earth Space Tai-Yin Huang, The Pennsylvania State U. An REU student at the University of Michigan participated in an 8-week field study in Senegal, West Africa, which flew several balloons into the atmosphere each week to measure tropospheric ozone. Ms. Rachel Fitzhugh was assisting in the project to study variability in tropospheric ozone associated with the unique characteristics of the climate and atmosphere over Senegal. Tropospheric ozone is the "bad" ozone at the ground layer of the atmosphere most often associated with air pollution and smog. Comparisons were made with meteorological data and the data were evaluated for possible correlations with the occurrence of the "Saharan Air Layer" (SAL), an elevated layer of Saharan air and dust. The SAL is usually associated with the African Easterly Waves (AEW) that travel westward across the Atlantic Ocean. SAL events are characterized by low relative humidity within the layer 750 to 5000 meters above the ground. The ozone level was compared with the occurrences of a SAL and AEW (or non-SAL) events. It was found that more ozone was present when the AEW was present than when the SAL was present. Further studies will be required to determine exactly what chemical reactions occur in the SAL that deplete ozone. The results of her research were presented in a poster during the Student Conference at this year's Annual Meeting of the American Meteorological Society in Phoenix, Arizona. The research was enabled by a partnership between Howard University and Cheikh Anta Diop University in Dakar, Senegal, in cooperation with her research advisor, Dr. Frank Marsik, and the REU site PI, Dr. Michael Combi. This workshop, partly sponsored by NSF, was held June 23-27, 2008 at the University of Corsica in Corte, France. It focused on "transient luminous events" (TLEs) such as sprites, jets, and elves, which are flashes of optical emissions in the stratosphere and mesosphere that occur above severe thunderstorms, and "Terrestrial Gamma-ray Flashes" (TGFs), bursts of X- and gamma-rays that have been observed above thunderstorms by spacecraft. These "fireworks" include Earth's largest electrical discharges reaching from the top of thunderclouds to the bottom of the ionosphere near 80 km altitude. TLEs and TGFs are newly discovered processes that couple the troposphere to the upper atmosphere and near-Earth space. The workshop aimed to better understand and identify the physical processes that couple thunderstorms to the Earth's upper atmosphere and ionosphere and the various effects of thunderstorm processes on the atmosphere and its dynamics. A compilation of the latest observations and theoretical studies has been published by the International Conference Proceedings Series of the American Institute of Physics (AIP). Dr. Tai-Yin Huang, associate professor of physics at Penn State Lehigh Valley, was co-coordinator with Dr. Norma Crosby from the Belgian Institute for Space Aeronomy. Seventy people representing 18 countries participated. Dr. Dieter Bilitza of George Mason University, Dr. C.K. Shum of Ohio State University, and a team of national and international collaborators have developed new models for the representation of the topside electron density in the International Reference Ionosphere (IRI). IRI is the international standard to specify ionospheric densities, temperatures, and velocities. The team re-analyzed topside sounder data from the sixties, seventies, and eighties, and developed new models that improve the densities up to a factor of two. The older IRI model overestimated the total electron content (TEC), a parameter that very important for space weather applications. At the magnetic equator, where TEC values are greatest, the new models achieve a 30% improvement in agreement with TOPEX measurements. Another important feature to represent accurately is the “Equatorial Anomaly", with lowest daytime densities at the equator and larger densities appearing in two crests to either side of the equator. Simulations with the new models show that the anomaly features are much better represented by the new topside models. Plots of the logarithm of electron density as a function of latitude and height, for longitude 0 degrees, 1600 LT, and medium solar activity. The left panel shows the old IRI model predictions, the middle panel, the new model, option 1; the right panel, the new model, option 2. The middle panel is the best representation of the Equatorial Anomaly.
NSF / AERONOMY : SCIENCE HIGHLGHTS 2009 Modeling vertical winds in the upper atmosphere Timothy Fuller-Rowell and Yue Deng, U. of Colorado-Boulder New method to estimate density in the ionosphere Mark Psiaki, Cornell U. Unique Observations of a “gigantic jet” over a thunderstorm Steve Cummer, Duke U. Prof. Mark Psiaki and the GPS group at Cornell University have developed and tested a new method to estimate ionospheric density variations that cause severe disturbances to radio signals. This work seeks to image the disturbed ionosphere in order to better understand the genesis and evolution of its irregularities. The new algorithm, an inverse diffraction algorithm, relies on GPS data and on a physical model of how electron density irregularities affect GPS signals. Figure 1 illustrates how GPS signals are affected by electron density bubbles and how an array of ground-based receivers is being used to characterize these bubbles. The new method has been applied to disturbed dual-frequency GPS data taken from Brazil. It has demonstrated an ability to fit GPS data at two frequencies to a single electron density profile, thereby verifying the effectiveness of its physical model and its data fitting algorithm. This work seeks to improve human understanding of ionospheric disturbances, both theoretically by providing imaging data and practically by providing realistic models. This understanding will help mankind to reduce these disturbances' severe impact on radio navigation and communications through the design of better radio equipment and through an improved ability to forecast these space weather anomalies. Prof. Cummer and his students at Duke University, under an existing NSF grant, have made the first simultaneous recordings of the optical and radio signatures of a gigantic jet erupting from the clouds of a tropical storm and reaching the very edge of space near 90 km altitude. Gigantic jets were discovered in 2002 and are a form of electrical breakdown in thunderstorms that, instead of traveling downward and contacting the ground like ordinary lightning, travels upward out of the thunderstorm. The radio measurements show that the observed gigantic jet is very much like upward lightning and transfers as much electric charge directly to the upper atmosphere as a very strong lightning stroke transfers to the ground. This shows that gigantic jets are a newly recognized form of transient but strong coupling between the lower and upper atmosphere. The non-hydrostatic effect on the thermosphere has been quantified using a general circulation model (GCM). Hydrostatic equilibrium is one common assumption used in most theoretical thermosphere/ionosphere models, under which the pressure gradient force is balanced by the gravity force in the vertical direction. This assumption represents the large-scale atmosphere behavior very well, but on small spatial scales and during short time periods non-hydrostatic processes can cause large vertical winds and strong disturbances of neutral density in the upper atmosphere. Preliminary results show that after a sudden enhancement of Joule heating, the force imbalance between the pressure gradient and gravity forces at high altitudes can be as large as 25% and can cause a vertically propagating disturbance. The large vertical wind at high altitudes is a superposition of in-situ thermo-expansion and a propagated wind disturbance from the lower altitudes, which adds a strong temporal variation. The evaluation of the non-hydrostatic effect on the upper atmosphere is of primary importance in properly modeling the global thermospheric/ionospheric system. This NSF-funded research is a necessary step in improving the ability to simulate the thermosphere/ionosphere response to magnetospheric energy input. (A) Temporal variation of the difference between the pressure gradient and gravity forces after a sudden enhancement of Joule heating at all altitudes at 0600 UT. (B) Temporal variation of the vertical wind after a sudden enhancement of Joule heating at all altitudes at 0600 UT. (C) & (D) Same as (A) & (B) except only including a Joule heating increase below 150 km altitude. The development of the gigantic jet is shown in the middle panel of grayscale video images, superimposed on an infrared satellite image. The bottom panel shows the low frequency radio pulse associated with the jet. Schematic diagram of a GPS remote-sensing array for inverse-diffraction imaging of the disturbed ionosphere.
NSF / AERONOMY : SCIENCE HIGHLGHTS 2009 Three dimensional imaging of the auroral ionosphere Josh Semeter and Thomas Butler, Boston U. Craig Heinselman, SRI International A New and Novel Radar at the Southern Tip of South America for Atmospheric Research Dave Fritts and Diego Janches, Northwest Research Associates Predicting Space Weather Mike Kelley, Cornell U. John Reterrer, AFRL, Hanscom AFB For the first time prior knowledge of the interplanetary electric field upstream of the Earth has been used to predict, in one case, the suppression of an ionospheric thunderstorm and, later the same evening, the eruption of a major storm event at an unusual time. The events are of a type called Convective Equatorial Ionospheric Storms since, much like a thunderstorm, low density material erupts upward, releasing stored gravitational energy. This is an important phenomenon since both communication and navigational systems can be severely affected by the associated turbulence. Drs. Mike Kelley and John Retterer used solar wind data obtained upstream of the Earth along with a physics-based assimilative model to successfully predict such an event during a strong magnetic storm in November 2004. In the accompanying figure, the red portion in the upper plot shows predictions of the AFRL model while in the central panel data from the Jicamarca, Peru, incoherent scatter radar show the eruption of turbulence at the time predicted. Note that the interplanetary electric field suppressed the eruption of turbulence at the normal time (18-19 local time) but energized the new storm at 22 UT, an unusual time for event onset. Incoherent scatter radar (ISR) is a powerful tool for studying the ionosphere and its interactions with the space environment. Prior to 2006, scanning the sky with an ISR meant mechanically steering a 30-ton dish antenna. The Poker Flat ISR (or PFISR) is the first ISR employing an electronically steerable array (ESA). This modality enables, for the first time, direct three-dimensional imaging of the Earth's plasma environment and a new observing paradigm for space plasma research. The PFISR beam is steered by carefully controlling the signals delivered to each of the 4096 antenna elements (see figure below). The rapid steering capability means that data are in essence acquired simultaneously from a set of predefined look-directions, analogous to the way images are acquired by a digital camera. A major difference with photography, however, is that radars also acquire information along the direction of each beam. Thus, PFISR can be used to construct three-dimensional (or volumetric) images of the ionospheric plasma at rapid cadence. The example in the figure shows plasma density at three horizontal cuts (100, 110, and 120 km) through the imaged volume, with a single vertical cut as a back plane. The colors depict structure in plasma density caused by the aurora. An NSF grant entitled "Dynamics and Meteor Studies Using a Novel Radar at a Critical Southern Latitude" was awarded to Drs. Diego Janches and Dave Fritts of NorthWest Research Associates, CoRA Division, for installation and operation of a new generation meteor radar at the southern tip of South America. The radar was installed at Rio Grande on Tierra del Fuego (54 S, 67.5 W) and has made routine measurements since May 2008. The radar was specifically designed for enhanced dynamics studies of the mesosphere and lower thermosphere between ~80 and 105 km altitude. This altitude region is among the most active on the planet because of very large amplitude wave structures and strong turbulence. The southern tip of South America is also the most dynamically active region on Earth because of the very strong generation of waves and turbulence over the southern Andes and by the strong jet stream over the Drake Passage that extend to high altitudes. Drs. Janches and Fritts have assembled an international team for this project, including colleagues from Argentina, Australia, Canada, and the UK and created a strong collaboration with Argentine scientists and students who are working together on this project. PFISR antenna viewed from the top corner. The radar location falls within a region of major wave and turbulence activity. Ionospheric plasma density over the radar at three heights along the north-south and east-west directions. Predictions (upper panel) and measurements of the electron density and the development of turbulence at the magnetic equator. The upper panel includes the linear growth rate for values above 5×10⁻⁴ s-1. The lower panel shows nonlinear development of plasma depletions.
NSF / AERONOMY : SCIENCE HIGHLGHTS 2009 Observations of breaking Alfven Waves Josh Semeter, Matthew Zettergren, and Marcos Diaz, Boston U. New results on coupling of the upper and lower regions of the ionosphere Roland Tsunoda and Russell Cosgrove, SRI International New observatories measure winds in the polar upper atmosphere John Meriwether and Miguel Larsen, Clemson U. Drs. Roland Tsunoda and Russell Cosgrove at SRI International have shown that long-lived metallic ions play active, surprisingly energetic roles in the complex electrodynamical response of the ionosphere. Earlier, they had discovered a new electrodynamical instability, one that acts on metallic-ion layers at E-region altitudes, near 100 km, and elicits a coupled response of the F layer, above 250 km, to strong electric field perturbations that map along geomagnetic field lines. With these findings, intense and vigorous disruptions of ionospheric plasma found at midlatitudes, which hitherto had remained unexplained, can now be understood in terms of this process. Recently, Dr. Tsunoda has shown that this basic process could also contribute to the development of plasma structure in the nighttime equatorial F layer and to the formation of subsidiary current sheets that have been observed by rockets along the flanks of the equatorial electrojet, a localized region of very strong electric fields that occurs within a few degrees of the geomagnetic equator. By using a radar on Christmas Island, Republic of Kiribati, he has now shown (see figure) that metallic ion layers which form at higher latitudes appear to drift equatorward and interact electrodynamically with the electrojet. These findings have important space-weather applications, through the forecasting of the above-mentioned disruptions of ionospheric plasma at middle and equatorial latitudes. The new finding, that subsidiary current layers could form near the electrojet if enough metallic ions are present, is a reminder that not all unexplained observations found in equatorial electrodynamics are simply consequences of tidal modes. Three observatories have been located in Alaska in close proximity to each other to make measurements of all three components of the upper atmosphere neutral winds over a volume of 100 km in extent. The observatories house Fabry-Perot interferometers which measure the Doppler shift and Doppler broadening of the auroral red line emission of atomic oxygen at 630 nm. The wind measurements will be combined with observations from the Poker Flat Incoherent Scatter Radar of the F-region plasma density and ion temperatures; the combinations of measurements will be used to investigate the small-scale coupling of the ions and neutrals in the polar upper atmosphere, a key driver of the dynamics. Of particular interest is the response of the thermosphere to the increased forcing of the plasma convection generated by sub-storm activity in the aurora. The three FPI stations are also used to measure as precisely as possible the divergence and vorticity of the thermospheric wind field as a means for characterizing the influence of particle heating and Joule heating upon the ion-neutral coupling. The figure shows a former undergraduate student at Clemson University, Russell Hedden, at the Fort Yukon observatory when the observatories were being installed at Fort Yukon, Eagle, and Poker, Alaska. Russell is now a graduate student at Cornell University on an NSF graduate fellowship. Despite decades of observation, imaging systems have yet to resolve the true spatial and temporal variability in the aurora. The narrowest arcs (~50 meters) are thought to be associated with dispersive Alfvén waves (DAWs) commonly observed by polar orbiting spacecraft, but a definitive signature in the optical aurora remains elusive. The introduction of Electron Multiplying CCD (EMCD) technology led to fundamental improvements in the ability to image faint ephemeral optical emissions, such as those produced in the aurora. In the spring of 2007, EMCCD was applied to the study of fine-scale auroral structure during an observing campaign at Poker Flat, AK. The upper figure shows a time sequence of images recorded at 30 frames/sec over a 4x4 degree field-of-view. The sequence shows the bifurcation of a narrow auroral arc into a multiple parallel-arc system in a manner consistent with the DAW model. The lower figure is a schematic illustration of the DAW. The dispersive wave has a component of its electric field directed along B, which modifies the auroral electron flux producing alternating light and dark features. Time sequence of auroral images showing an arc splitting into multiple parallel structures. Former Clemson undergraduate student Russell Hedden at Fort Yukon observatory. A schematic of the dispersion process.
NSF / AERONOMY : SCIENCE HIGHLGHTS 2009 New ionospheric monitoring station deployed in the Caribbean Jonathan Makela U. Illinois at Urbana-Champaign Multi-line Investigation of the Hydrogen Geocorona Ed Mierkiewicz, Fred Roesler, and Matt Haffner, U. Wisconsin-Madison New instrument to measure oxygen in the upper atmosphere Steve Watchorn, Scientific Solutions Inc. As part of its Thermospheric Coupling and Dynamics (TCD) program, Scientific Solutions, Inc., of North Chelmsford, Massachusetts, has built and deployed a new instrument, the Spatial Heterodyne Spectrometer (SHS; Figure 1), to observe oxygen emissions in the near-infrared part of the spectrum at the Millstone Hill Observatory in Westford, Massachusetts. Oxygen is the most abundant atom between 250 and 500 km altitude and contributes greatly to Space Weather and the dynamic conditions in the upper atmosphere. These conditions have a significant effect on satellites which serve a wide variety of ground activities, including cell phone communication and GPS operation. The analysis of oxygen emission spectra from the atmosphere (see Figure 2) are vital to the effort to model Space Weather and mitigate its deleterious effects on everyday activities, analogous to how news weather forecasts -- dealing with the lower atmosphere, near the ground -- help mitigate the effects of severe weather on everyday activities. The SHS instrument has come on line in 2008, and took its first spectrum of an in-lab calibration source. It will continue its observations in 2009 in collaboration with the University of Illinois. The existence of a diffuse "corona" of hydrogen at the top of the Earth's atmosphere was predicted in the mid 19th century. One hundred and fifty years later, the distribution of hydrogen in the upper atmosphere remains poorly understood. Scientists at the University of Wisconsin have developed a spectroscopic technique that opened a new window on geocoronal studies, leading in 2008 to the highest precision ground-based multi-line observations of geocoronal hydrogen Balmer emission ever obtained (Figure 1). Because solar ultraviolet lines with different atmospheric scattering properties primarily excite Balmer-alpha and -beta emissions, these data place tight constraints on hydrogen density distributions retrieved from forward-model analysis. These density distributions are needed to test atmospheric photochemical modeling of hydrogen- containing molecules. In a project sponsored by the National Science Foundation (NSF), a new ionospheric monitoring station was recently installed on the island of Trinidad in the Caribbean by Prof. Jonathan J. Makela and his team in the Remote Sensing and Space Sciences group in the Department of Electrical and Computer Engineering at the University of Illinois at Urbana-Champaign. This represents a new collaboration with the Department of Surveying and Land Information at the University of the West Indies and extends the capabilities of studying structures in the ionosphere to the southern Caribbean. Assisted by graduate students from both the University of Illinois and the University of the West Indies, the team installed an ionospheric imaging system and dual frequency GPS receiver. An initial campaign to study the properties of mid-latitude ionospheric structure and its effect on radio wave propagation was conducted in November 2008 in conjunction with the NSF-sponsored Arecibo Observatory in Puerto Rico. Balmer-alpha and -beta "nightglow" observations (Kitt Peak, AZ) vs. universal time for February 9, 2008. The observed variations in these intensities are strongest with respect to time of night (as the solar depression angle changes). Smaller variations due to changes in viewing geometry (see e.g., zoom in of points near 7:30) are also apparent. (Top) Fringe output of the Spatial Heterodyne Spectrometer. (Bottom) Oxygen near-IR spectrum, near 844.6 nm wavelength, recovered from the fringe output by means of a Fourier transform. The width and relative intensities of the peaks contain information about the temperature and dynamics (winds) of oxygen atoms in the atmosphere. This calibration image was obtained in 2008. A student from U. of Illinois and a student from the University of the West Indies installing some of the equipment in the Caribbean.
NSF / AERONOMY : SCIENCE HIGHLGHTS 2009 Undergraduates help determine altitudes of sprites Hans Nielsen, University of Alaska - Fairbanks, Geoff McHarg, US Air Force Academy, Ryan Haaland, Fort Lewis College Imaging Stationary Mountain Gravity Waves in the Night-time Mesosphere Steve Smith, Boston University New Insights into Ionospheric Irregularities Jonathan Makela U. Illinois at Urbana-Champaign The Mesospheric Dynamics Group at Boston University lead by Dr. Steven Smith has imaged for the first time stationary mountain gravity waves in three nightglow emissions from hydroxyl molecules (OH), sodium (Na), and atomic oxygen (O(1S)) over the El Leoncito Observatory in Argentina through an NSF-funded award (ATM#0535453). The waves have horizontal scales of 30 to 40 km and lifetimes of several hours. They appear to be a common feature during winter months and have been recorded on several consecutive nights, particularly during periods of strong eastward winds flowing over the Andes Mountains. The accompanying figure shows three time-averaged images of mesospheric OH nightglow taken at El Leoncito. Each image was obtained by averaging ~60 images spanning a time period of over 11.5 hours, on successive nights of 2 - 4 July 2008. A large and extensive stationary wave structure oriented North-South and parallel to the Andes range is clearly visible during all three nights in the OH emission at 84 km altitude. Similar structures were visible in the Na and O(1S) emissions near 90 km and 96 km altitude, respectively. This new ability to image mesospheric mountain waves has important implications for quantifying the amount of energy and momentum being deposited in the mesosphere due to air flow over mountains in the lower atmosphere. Ionospheric irregularities can cause severe degradation of radio waves, such as those used for satellite communication and navigation signals which propagate through them. New insights into the field-aligned structure of irregularities near the equator have been made by using a suite of instruments located at the National Science Foundation (NSF) sponsored Cerro Tololo Inter-American Observatory. Prof. Jonathan J. Makela and his team in the Remote Sensing and Space Sciences group in the Department of Electrical and Computer Engineering at the University of Illinois at Urbana-Champaign have used an ionospheric imaging system to obtain images of the depletions in the Earth's ionosphere associated with the irregularities. Using these images, an estimate of the ionospheric volume affected by the irregularities can be obtained and extruded along the Earth's magnetic field lines to the conjugate hemisphere. When combined with GPS-occultation data from the COSMIC/FORMOSAT-3 constellation of satellites, estimates of irregularity scattering heights can be made by examining where the satellite occultation links intersect with the ionospheric volume obtained from the images. The preliminary study confirms that irregularity scattering altitudes are typically confined to altitudes near the peak density of the ionospheric F-layer. Two undergraduate students obtained their first experimental research experiences by taking part in a field campaign to observe and image sprites. Sprites are large luminous features occurring at altitudes of 35-100 km that are associated with electrically active thunderstorms. The research project aimed to obtain high time resolution images and spectra in order to identify details of the processes involved in the various phases of a sprite event as well as their altitude dependence. The two students were from Fort Lewis College in Durango, CO, supervised by Dr. R. Haaland in the engineering-physics program. The students operated video cameras at one observing site at Portales, NM, while Dr. Haaland fielded similar equipment at another site in Las Vegas, NM. This allowed the researchers to triangulate on images of the sprites, enabling determination of an accurate altitude for the onset of sprites. Relatively few triangulated observations have been reported earlier so this project represents a substantial addition to the database. The participation of the undergraduate students made these observations successful by allowing the fielding of three stations during the campaign. Left: The sprite observing team; from left to right: T. Kanmae and H.C. Stenbaek-Nielsen from the U. of Alaska-Fairbanks; students Brian "Bo" Hensley and Garrett Dean, Fort Lewis College, M.G. McHarg, US Air Force Academy, and R. Haaland, Fort Lewis College. Right: Garrett and Bo working on the instrument mount. Images of the OH nightglow over El Leoncito, Argentina, on three consecutive days which show wave structures associated with gravity waves. By combining ground-based and space-based observations, estimates can be made of the heights of the observed ionospheric features.
NSF / AERONOMY : SCIENCE HIGHLGHTS 2009 Measurements of Auroral Disturbance Electrodynamics Larry Lyons, UCLA Solar Cyclic Variations in Geocoronal Hydrogen Observations Susan Nossal, Ed Mierkiewicz, and Fred Roesler, U. Of Wisconsin-Madison Coupled Modeling of the Equatorial Ionosphere during Geomagnetic Storms Results from the Center for Integrated Space Weather Modeling (CISM) Understanding the upper atmosphere and coupling processes between atmospheric regions is becoming increasingly recognized as important for obtaining a whole Earth view of the climate system. Hydrogen forms the upper boundary of the Earth's atmosphere and is a byproduct of species below such as methane and water vapor, two greenhouse gases. Scientists at the University of Wisconsin are establishing a high precision data set of upper atmospheric hydrogen nightglow intensities that can be used as a reference data set far into the future and for investigating changes over periods now spanning several solar cycles. The figure shows observations of hydrogen taken during Solar Cycle 23. The solar cycle is a dominant source of natural variability in the upper atmosphere and must be accounted for when isolating potential signs of long-term change in the region. The observed trend (colored symbols) of higher hydrogen emission intensities during solar maximum periods compared with solar minimum periods is consistent with modeling studies (black symbols), although there are significant differences in magnitude between the predicted and observed intensities. These differences highlight the need for improved upper atmosphere hydrogen density determinations. Graduate student Shasha Zou, in collaboration with Professor Larry Lyons and others in his research group at UCLA, has obtained fundamental new understanding of the electrodynamics properties of geomagnetic substorms. A substorm is a major Space Weather disturbance that can have damaging effects on man-made electrical systems in space and on the ground, but understanding of substorm physics has been an elusive and controversial topic for the past few decades. By taking advantage of measurements made by coherent-scatter radars, the new incoherent scatter radar at Poker Flat, and complementary ground-based instruments and auroral observations, it was found that the auroral activity at substorm onset is located in the center of a flow shear region called the Harang reversal. This flow reversal is a key region in the ionosphere and magnetosphere and is a central part of the Region 2 electrical current system that connects the magnetosphere and ionosphere. The radar observations have also shown that flows exhibit repeatable distinct variations at different locations relative to that of the substorm-related auroral activity. This has provided a 2-D picture of the important features of the substorm process and has for the first time revealed a close relationship between the substorm and the Region 2 systems. Physical interactions between the magnetosphere and the ionosphere-thermosphere affect processes in both regions during magnetic storms. CISM's Coupled Magnetosphere-Ionosphere-Thermosphere (CMIT) model is an important step in understanding, and ultimately predicting, the coupled system behavior. The new version of CMIT introduces the NCAR TIEGCM model of the ionosphere-thermosphere, providing the capability to study global ionospheric disturbances during geomagnetic storms. The figure below shows modeled equatorial vertical ion drifts (red line) compared to measurements by the Jicamarca radar (blue crosses). April 2, 2004, was a quiet day, followed by a significant geomagnetic storm that began at 2 UT on April 3. In the top panel, the stand-alone TIEGCM model captures many of the overall trends, but does not successfully represent the dynamic structure that is caused by interactions with the magnetosphere. The coupled CMIT model, in the bottom panel, provides a much better characterization of the dynamics of the coupled system. Temporal variations in the model are consistent with the data, but somewhat overestimated, due to the lack of a full characterization of region-2 shielding currents. This work illustrates the importance and promise of using coupled models to represent the complex physics of space weather. The panels show, from top to bottom, the development of a narrow region of current moving in opposite directions near the Harang reversal. Blue arrows and pink arrows indicate the directions of the current flow. Observations of hydrogen taken during the past 10 years (colored symbols) compared to model predictions (black symbols). From Wang et al., GRL, 2008