Download
1 / 12
170 likes | 414 Views
Health Indicators. Infant Mortality : Annual number of children under 1 year of age who die per 1,000 live births Under 5 Mortality/5 yr Child Survival Life Expectancy at birth (in years) Prevalence (disease) : proportion of a population afflicted at a given point in time

E N D
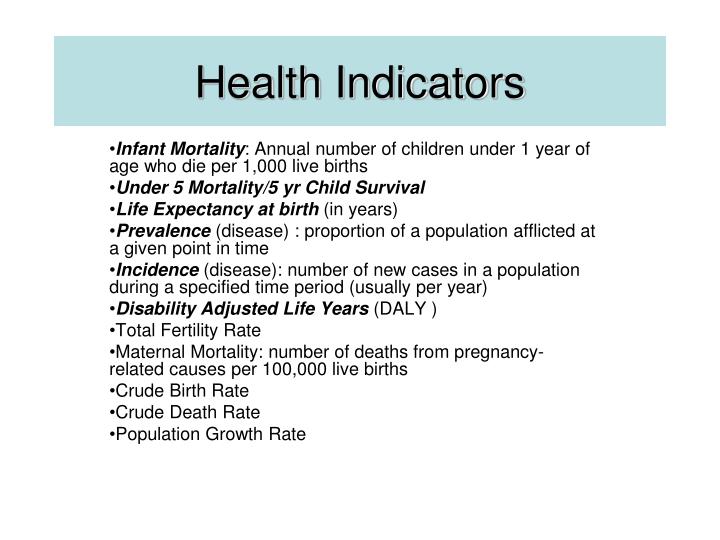
Health Indicators Infant Mortality: Annual number of children under 1 year of age who die per 1,000 live births Under 5 Mortality/5 yr Child Survival Life Expectancy at birth (in years) Prevalence (disease) : proportion of a population afflicted at a given point in time Incidence (disease): number of new cases in a population during a specified time period (usually per year) Disability Adjusted Life Years (DALY ) Total Fertility Rate Maternal Mortality: number of deaths from pregnancy-related causes per 100,000 live births Crude Birth Rate Crude Death Rate Population Growth Rate
Infant Mortality: Annual number of children under 1 year of age who die per 1,000 live births World 1960 126/1,000 live births World 2002 56/1,000 live births Good measure of overall health and community well-being. Structural factors affecting the health of entire populations have an impact on the mortality rate of infants. Especially useful in low income and middle income countries
Under-five Mortality: Annual number of children dying between birth and 5 years of age who die per 1,000 live births World 1960 197/1,000 live births World 2002 82/1,000 live births
Life Expectancy at Birth: Number of years a newborn would live subjected to the present mortality risks prevailing for each age group in the population World 1960 48 years World 2002 63 years Lowest in Sub-Saharan Africa (46) and highest in Japan (78) for 2002. Good measure of socio-economic development.
Disability-adjusted life years (DALY ) Indicator that measures disease burden in a population, taking into account premature mortality, and disability caused by disease or injury
Calculating DALYS • Using 107 diagnoses, and 95% of the causes of disability • “Gold Standard” is living in a healthy state (Level of health =1, Death=0), dying at 80 years old (men) or 82.5 years old (women) • Years of Lost life (YLL)= years lost by premature death, ex. 64 for a boy who dies at age 16yo • Time in which disability is experienced is given a severity rating (ex. Schizophrenia is a 0.8 loss, knee injury is a 0.1 loss) and that time added to YLL • Age weights: value of a year lost rises steeply from birth (0.1) to 25 years old (1.4) and then decreases progresively: so for death as a newborn= 32.5 DALY value, at 30 years 29 =DALY value and death at 60 =12 DALY value. • Years lost in the future are discounted, so that years lost now are worth more that years lost in the future, at a discount of 3% per year.
Criticism of the DALYs 1. Built in gender difference 2. Built in age preference 3. Discounting future years 4. Weighting severity of disability
Leading Causes of the Global Burden of Disease 2002 DALYs % • Perinatal conditions 6.5 • Lower respiratory infections 6.1 • HIV/AIDS 5.7 • Depression 4.5 • Diarrhoeal diseases 4.2 • Ischaemic heart disease 3.9 • Cerebrovascular disease 3.3 • Malaria 3.1 • Road traffic accidents 2.6 • Tuberculosis 2.3 Source: World Health Report, 2004
Health Adjusted Life Expectancy (HALE) The number of years a newborn can expect to live in full health, based on current statistics of morbidity and mortality Japan =72 years Afghanistan=36 years
Japan Malta USA Cuba Georgia Sao Tome & Prince