Download

1 / 56
560 likes | 669 Views
2. The Data of Macroeconomics. IN THIS CHAPTER, YOU WILL LEARN:. …the meaning and measurement of the most important macroeconomic statistics: g ross domestic product (GDP) the consumer price index (CPI) t he unemployment rate. 1. Gross Domestic Product: Expenditure and Income.

E N D
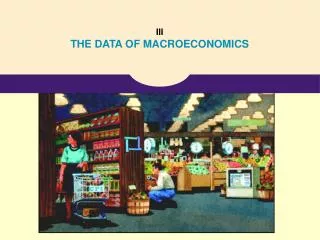
2 The Data of Macroeconomics
IN THIS CHAPTER, YOU WILL LEARN: …the meaning and measurement of the most important macroeconomic statistics: • gross domestic product (GDP) • the consumer price index (CPI) • the unemployment rate 1
Gross Domestic Product: Expenditure and Income Two definitions: • Total expenditure on domestically-produced final goods and services. • Total income earned by domestically-located factors of production. Expenditure equals income because every dollar a buyer spendsbecomes income to the seller.
Income ($) Labor Goods Expenditure ($) The Circular Flow Firms Households
Final goods, value added, and GDP • GDP = value of final goods produced = sum of value added at all stages of production. • The value of the final goods already includes the value of the intermediate goods, so including intermediate and final goods in GDP would be double counting.
Gross Domestic Product Final Goods and Services final goods and servicesGoods and services produced for final use. intermediate goodsGoods that are produced by one firm for use in further processing by another firm. value addedThe difference between the value of goods as they leave a stage of production and the cost of the goods as they entered that stage.
Gross Domestic Product Final Goods and Services In calculating GDP, we can sum up the value added at each stage of production or we can take the value of final sales. We do not use the value of total sales in an economy to measure how much output has been produced.
NOW YOU TRYIdentifying value added • A farmer grows a bushel of wheat and sells it to a miller for $1.00. • The miller turns the wheat into flour and sells it to a baker for $3.00. • The baker uses the flour to make a loaf of bread and sells it to an engineer for $6.00. • The engineer eats the bread. Compute value added at each stage of production and GDP 7
The expenditure components of GDP • consumption, C • investment, I • government spending, G • net exports, NX An important identity: Y = C + I + G + NX aggregate expenditure value of total output
Consumption (C) • durable goodslast a long time e.g., cars, home appliances • nondurable goodslast a short time e.g., food, clothing • servicesintangible items purchased by consumers e.g., dry cleaning, air travel definition: The value of all goods and services bought by households. Includes:
U.S. consumption, 2013 $ billions % of GDP Consumption Durables 1,273 7.9 Nondurables 2,599 16.2 Services 7,499 46.9 11,372 71.1
Calculating GDP The Expenditure Approach
Investment (I) • Spending on capital, a physical asset used in future production • Includes: • Business fixed investmentSpending on plant and equipment • Residential fixed investmentSpending by consumers and landlords on housing units • Inventory investmentThe change in the value of all firms’ inventories
U.S. Investment, 2013 $ billions % of GDP Investment Business fixed 2,102 13.1 Residential 425 2.6 Inventory 48 0.3 2,151 13.4
Calculating GDP The Expenditure Approach Gross Private Domestic Investment (I) change in business inventoriesThe amount by which firms’ inventories change during a period. Inventories are the goods that firms produce now but intend to sell later. Change in Business Inventories GDP = Final sales + Change in business inventories
Investment vs. Capital Note: Investment is spending on new capital. Example (assumes no depreciation): • 1/1/2012: Economy has $10 trillion worth of capital • during 2012:Investment = $2 trillion • 1/1/2013: Economy will have $12 trillion worth of capital
Flow Stock Stocks vs. Flows A flow is a quantity measured per unit of time. E.g., “U.S. investment was $2 trillion during 2013.” A stock is a quantity measured at a point in time. E.g., “The U.S. capital stock was $10 trillion on January 1, 2013.”
Stocks vs. Flows - examples stock flow a person’s wealth a person’s annual saving # of people with college degrees # of new college graduates this year the govt debt the govt budget deficit
NOW YOU TRYStock or Flow? • the balance on your credit card statement • how much you study economics outside of class • the size of your MP3/iTunes collection • the inflation rate • the unemployment rate 18
Government spending (G) • G includes all government spending on goods and services. • G excludes transfer payments (e.g., unemployment insurance payments), because they do not represent spending on goods and services.
U.S. Government Spending, 2013 1,177 7.3 408 2.5 768 4.8 1,846 11.5 $ billions % of GDP Govt spending 3,023 18.9 - Federal Non-defense Defense - State & local
Net exports (NX) • NX = exports – imports • exports: the value of g&s sold to other countries • imports: the value of g&s purchased from other countries • Hence, NX equals net spending from abroad on our g&s
NOW YOU TRYAn expenditure-output puzzle? Suppose a firm: • produces $10 million worth of final goods • only sells $9 million worth • Does this violate the expenditure = output identity? 23
Why output = expenditure • Unsold output goes into inventory, and is counted as “inventory investment”… whether or not the inventory buildup was intentional. • In effect, we are assuming that firms purchase their unsold output.
GDP: An important and versatile concept We have now seen that GDP measures: • total income • total output • total expenditure • the sum of value added at all stages in the production of final goods
GNP vs. GDP • Gross nationalproduct (GNP):Total income earned by the nation’s factors of production, regardless of where located • Gross domestic product (GDP):Total income earned by domestically-located factors of production, regardless of nationality GNP – GDP = factor payments from abroad minus factor payments to abroad • Examples of factor payments: wages, profits, rent, interest & dividends on assets
From the perspective of the U.S., factor payments from abroad include things like • wages earned by U.S. citizens working abroad • profits earned by U.S.-owned businesses located abroad • income (interest, dividends, rent, etc) generated from the foreign assets owned by U.S. citizens • Factor payments to abroad include things like • wages earned by foreign workers in the U.S. • profits earned by foreign-owned businesses located in the U.S. • income (interest, dividends, rent, etc) that foreigners earn on U.S. assets
GNP vs. GDP in select countries, 2011 GNP and GDP in millions of current U.S. dollars
Real vs. nominal GDP • GDP is the value of all final goods and services produced. • Nominal GDP measures these values using current prices. • Real GDPmeasure these values using the prices of a base year.
Nominal versus Real GDP Calculating Real GDP
Real GDP controls for inflation • Changes in nominal GDP can be due to: • changes in prices • changes in quantities of output produced • Changes in real GDP can only be due to changes in quantities, because real GDP is constructed using constant base-year prices.
U.S. Nominal and Real GDP,1960-2013 (billions) Real GDP(in 2005 dollars) Nominal GDP
GDP Deflator • Inflation rate: the percentage increase in the overall level of prices • One measure of the price level: GDP deflator Definition:
NOW YOU TRYGDP deflator and inflation rate • Use your previous answers to compute the GDP deflator in each year. • Use GDP deflator to compute the inflation rate from 2010 to 2011, and from 2011 to 2012. 34
NOW YOU TRYAnswers • Use your previous answers to compute the GDP deflator in each year. • Use GDP deflator to compute the inflation rate from 2010 to 2011, and from 2011 to 2012. 35
Chain-Weighted Real GDP • Over time, relative prices change, so the base year should be updated periodically. • In essence, chain-weighted real GDPupdates the base year every year, so it is more accurate than constant-price GDP. • Your textbook usually uses constant-price real GDP, because: • the two measures are highly correlated. • constant-price real GDP is easier to compute.
Consumer Price Index (CPI) • A measure of the overall level of prices • Published by the Bureau of Labor Statistics (BLS) • Uses: • tracks changes in the typical household’s cost of living • adjusts many contracts for inflation (“COLAs”) • allows comparisons of dollar amounts over time
How the BLS constructs the CPI 1. Survey consumers to determine composition of the typical consumer’s “basket” of goods 2. Every month, collect data on prices of all items in the basket; compute cost of basket 3. CPI in any month equals
NOW YOU TRYCompute the CPI Basket: 20 pizzas, 10 compact discs For each year, compute • the cost of the basket • the CPI (use 2012 as the base year) • the inflation rate from the preceding year prices: pizza CDs 2012 $10 $15 2013 11 15 2014 12 16 2015 13 15 39
NOW YOU TRYAnswers Cost of Inflation basket CPI rate 2012 $350 100.0 n.a. 2013 370 105.7 5.7% 2014 400 114.3 8.1% 2015 410 117.1 2.5% 40
Why the CPI may overstate inflation • Substitution bias: The CPI uses fixed weights, so it cannot reflect consumers’ ability to substitute toward goods whose relative prices have fallen. • Introduction of new goods: The introduction of new goods makes consumers better off and, in effect, increases the real value of the dollar. But it does not reduce the CPI, because the CPI uses fixed weights. • Unmeasured changes in quality: Quality improvements increase the value of the dollar but are often not fully measured.
The size of the CPI’s bias • In 1995, a Senate-appointed panel of experts estimated that the CPI overstates inflation by about 1.1% per year. • So the BLS made adjustments to reduce the bias. • Now, the CPI’s bias is probably under 1% per year.
CPI vs. GDP Deflator Prices of capital goods: • included in GDP deflator (if produced domestically) • excluded from CPI Prices of imported consumer goods: • included in CPI • excluded from GDP deflator The basket of goods: • CPI: fixed • GDP deflator: changes every year
Two measures of inflation in the U.S. CPI GDP deflator
Unemployment Measuring Unemployment employedAny person 16 years old or older (1) who works for pay, either for someone else or in his or her own business for 1 or more hours per week, (2) who works without pay for 15 or more hours per week in a family enterprise, or (3) who has a job but has been temporarily absent with or without pay. unemployedA person 16 years old or older who is not working, is available for work, and has made specific efforts to find work during the previous 4 weeks.
Unemployment Measuring Unemployment not in the labor forceA person who is not looking for work because he or she does not want a job or has given up looking. labor forceThe number of people employed plus the number of unemployed. labor force = employed + unemployed population = labor force + not in labor force
Two important labor force concepts • unemployment rate percentage of the labor force that is unemployed • labor force participation rate the fraction of the adult population that “participates” in the labor force, i.e. is working or looking for work
NOW YOU TRYComputing labor statistics U.S. adult population by group, May 2013 Number employed = 143.9 million Number unemployed = 11.8 million Adult population = 245.4 million Use the above data to calculate • the labor force • the number of people not in the labor force • the labor force participation rate • the unemployment rate 49