Download
1 / 60
660 likes | 928 Views
Causal Inference and Evaluation of Complex Interventions. Mi-Suk Kang Dufour, Ph.D. M.P.H. Mi-Suk.KangDufour@ucsf.edu Center for AIDS Prevention Studies, University of California, San Francisco. Outline. Statistical vs. Causal Association Some models for thinking about causality

E N D
Causal Inference andEvaluation of Complex Interventions Mi-Suk Kang Dufour, Ph.D. M.P.H. Mi-Suk.KangDufour@ucsf.edu Center for AIDS Prevention Studies, University of California, San Francisco
Outline • Statistical vs. Causal Association • Some models for thinking about causality • Study design options and causality • Examples in Combination/Comprehensive HIV prevention
What do a study’s findings mean????? • Need to answer two questions: • How sure are you that the findings aren’t just a random fluke? • Statistical inference • How sure are you that the findings mean anything? • Causal inference
Statistical tests help us deal with one type of error X X X X X X X X X X X X X X X XX X
What is Statistical Inference? • We want to be able to generalize from a study sample to the source population • The study sample comes from a source population, but it’s only one of many samples that could have been drawn by chance • You want to quantify your certainty about how well this sample represents the source population • In terms of any possible measure from that study (e.g., mean, prevalence, RR, RD etc) Source Population Study Sample ??
Statistical Inference Summary • Quantify the role of random error in our study findings • Quantify our certainty about how well our study sample represents the source population • Two main approaches to statistical inference in epidemiology • Hypothesis testing (p values) • Confidence interval estimation
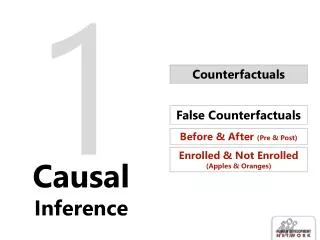
Causal Inference Definition of a cause • Rothman & Greenland: “an event, condition, or characteristic that preceded the disease event and without which the disease event either would not have occurred at all or would not have occurred until some later time” Relationship between associations and causes • An association does NOT imply a cause • Carrying matches in your pocket is strongly associated with lung cancer
Bradford Hill’s Guidelines for Causation 1. Strength of the association • Strong associations more likely to be causal than small ones because it is unlikely they are accounted for entirely by bias and confounding • Commentary: weaker associations may be causal too 2. Consistency • Associations observed in different places, circumstances, times are more likely to be causal • Commentary: repetition not necessary for establishing causality
Bradford Hill’s Guidelines for Causation 3. Specificity • One cause should lead to a single effect and vice versa • Commentary: generally considered a useless criterion as many diseases have more than one cause, and many exposures cause more than one disease 4. Temporality • The cause must precede the disease • Commentary: only criterion completely agreed upon by epidemiologists
Bradford Hill’s Guidelines for Causation 5. Biological gradient (dose response) • An association where increase in amount of exposure increases risk of disease is more likely to be causal • Commentary: there are many more complicated relationships such as threshold or curvilinear – so the lack of a dose response relationship only suggests that the exposure does not act in a dose response manner 6. Plausibility • An existing biological or social model should explain the association • Commentary: current knowledge is never complete, so a lack of an existing model does not preclude a causal relationship
Bradford Hill’s Guidelines for Causation 7. Coherence • A cause and effect interpretation should not conflict with what is known about biology of the disease (related to plausibility) • Commentary: lack of coherence does not preclude causality (e.g., could be a new strain of disease, what is known may come from models that do not translate well to humans) 8. Experiment • Not really a guideline – more a statement about the importance of considering experimental evidence if it is available • Commentary: experiments are often infeasible or unethical so we only have observational studies
Bradford Hill’s Guidelines for Causation 9. Analogy • Similarity between the observed association and other associations would make causality likely • Commentary: absence of analogy may suggest lack of imagination, or lack of other exposures with similar mechanisms – not lack of causation A reminder from Bradford Hill about statistical inference: • “No formal tests of significance can answer those questions [of causality]. Such tests, can, and should, remind us of the effects that the play of chance can create… Beyond that, they contribute nothing to the ‘proof’ of our hypothesis”
Sufficient-Component Cause Model Described by Rothman in 1976 • Sufficient cause is a minimal set of factors that unavoidably produce disease • Sufficient cause can be thought of as a disease process or disease pathway • There may be several sufficient causes of one disease • Each factor in a sufficient cause is called a component cause • A component that is present in every sufficient cause is called a necessary cause • Depicted with “causal pies”
A A B B U U C F E H D G Sufficient-Component Cause Model • How many sufficient causes are depicted? • What is an example of a component cause in this diagram? • Assuming these are all of the causal pies for a certain disease, what is an example of a necessary cause? • How could you prevent pathway 2 without preventing pathway 1 to disease? Pathway 1 to disease Pathway 2 to disease
Transfused blood HIV infected Blood Transfusion Sufficient-Component Cause Model: HIV infection example Intercourse with HIV infected individual No condom during intercourse Microabrasion during intercourse
Sufficient-Component Cause Model More thoughts on/implications of this model • The risk of disease in a given group, is the proportion of individuals for whom a sufficient cause has formed • Apparent “strength” of an exposure in causing disease depends entirely on the distribution or prevalence of the other component causes • Strength of association between PKU genetic mutation and Phenylketonuria depends on amount of phenylalanine in the diet in the population studied • Component causes in the same sufficient cause are considered to interact • Component causes that are not part of the same sufficient cause are considered independent
Counterfactual framework AIDS ART Deatht Person A OBSERVED: Time Counterfactual question: how long would Person A have survived had if he/she had not received treatment?
Counterfactual framework HIV ART Deatht Person A OBSERVED: Time HIV No ART Deathnt Person A UNOBSERVED:
Counterfactual framework • “Ideal experiment” illustrates the framework • a hypothetical study which, if we could actually conduct it, would allow us to infer causality • Ideal experiment: • Person or population experiences one exposure and observed for outcome over a given time period • Roll back the clock • Change the exposure but leave everything else the same, observe for outcome over the same time period
Counterfactuals – specifying what we really want to know • Thinking about the counterfactual outcome(s) as something we are missing and something we are trying to estimate when we analyze HIV studies or any epidemiologic data is instructive • Akin to a missing data problem • When we compare groups of people observed as exposed or unexposed we want to compare groups that best estimate the counterfactual outcomes that are unobserved or missing
Rationale for Randomization • When we randomize individuals (or groups or clinics etc) to be exposed to a treatment we are assuming that any differences in the individuals treated and the individuals not treated are due only to chance • We are essentially using the experience of the unexposed to represent what would have happened to the exposed if they had not been exposed • This generally works out as long as: • The sample is big enough • There is no “contamination” • We are able to observe all the outcomes on all units
At what level are we randomizing? • At the individual level: • Drug A vs drug B • Intervention A vs Intervention B • At the group level: • Clinic management changes • Couples counseled vs not • Household sanitation • At geographic levels: • Community interventions • State/regional laws • Country policy changes
The Evidence Pyramid? Systematic reviews and meta-analyses SRs Randomised control trials RCTs Cohort studies Case Control studies Case series & case reports Animal Research In vitro (“test tube”) research Expert opinion
Why not stick to RCTs? • Not always feasible or ethical to randomize the factor(s) you are interested in • People who participate in randomized studies are usually different from the population you want to understand • Over time, the randomization can fail • Loss to follow up • Non-adherence to randomization • Contamination between arms
Why not stick to RCTs? • RCTs are often expensive and logistically challenging • Not always feasible randomize all the parts of a multi-component or multi-level intervention/program • Potentially long wait time for results • Need to balance research/evaluation with the imperative to implement programs as soon as possible
Moving Beyond RCTs • Lots of the key questions in HIV prevention cannot or will not be answered by randomized trials • Neither individual RCTs nor CRTs • Even if all exposures/factors are not randomized, some control of the “treatment” may be possible • Lots of data being generated outside RCTs • Data on Outcomes/Processes/ Structure • We need to make the best possible use of these data to learn what works in practice
Other study design options • Step-Wedge designs – randomize timing of roll-out • Time-Series approaches • Serial cross-sections • Using surveillance data • Incorporation of mathematical modeling
Counterfactual framework HIV ART Deatht Person A OBSERVED: Time HIV No ART Deathnt Person A UNOBSERVED:
Randomized vs Non-Randomized exposure No ART Deatht ART ART Deatht Deatht Illness, gender, Socioeconomic status, Health care access, Etc…. Randomized: NON - Randomized: Randomization Time Time No ART Deatht
Methods to adjust for non-random “treatment” • Inverse probability weighting • G-computation • Propensity scores
HIV Suppression Stops Transmission “HPTN 052 is a game changer” Michel Sidibe, Executive Director of UNAIDS 96% HPTN 052: HIV+ persons with CD4 350-550, adhered to ART, reducing the risk of transmission to sexual partners
Treat to prevent: Aspiration Meets Reality 80% 77% 66% 89% 77% Multiplies to 28% Only 28% of HIV+ Americans have optimal suppession ! Refs: MMWR 2011; Gardner Clin Inf Dis 2011; Burns Clin Inf Dis 2010
Highly Active HIV Prevention Coates, Lancet, 2008
Combination prevention • Evidence-based components • ART for prevention (Testing and linkage to care) • Male circumcision (Africa) • PrEP (MSM); future microbicides? • Behavioral, community, social support • Structural elements (QI, systems, incentives) • Economic factors (food insecurity, housing, economic stability) • STI control (highly desirable, uncertain impact) • Health care worker education (“DEBIs for Doctors”) • Co-morbidities, including needle exchange/drug treatment
Tools to inform rigorous impact evaluation of combination interventions • Formal causal frameworks • Defining research questions • Representing knowledge • Study design: Understanding what need to measure to answer these questions • Interpreting results: Make any non-testable assumptions explicit and understandable • Novel statistical methods • Can account for differences in exposure to treatments that are not randomized • Avoid statistical assumptions not supported by knowledge • Reduce bias, improve precision, valid inferences
Examples of Counterfactual Questions: • Ex. Average treatment effects • How would HIV incidence have differed if every community had versus did not have an PMTCTprogram? • How would vertical transmission rates have differed in the presence versus absence of the intervention? • Ex. Casual dose response curves • How does average HIV incidence change as a function of proportion of positives suppressed? • How do vertical transmission rates differ as a function of timing of first ANC visit? • Ex. Mediation/Direct and Indirect Effects • Effect of intervention arm not mediated by behavior/network change?
Understanding what variables to measure • Ex: Casual Graphs and Confounding • What factors do you need to measure in order to control for fact that variability in program implementation is not random? • Challenge, esp. in groups/communities: often have small sample size- limits how much you can adjust for Baseline Prevalence PMTCT Program roll out Clinic Implementation HIV Incidence
Recognizing threats to validity… • Ex. Informative missingness/LTFU • What individual level factors do you need to measure to get a valid estimate of HIV incidence? • In absence of tracking, CHC attendance determines if outcome measured • If HIV status affects measurement of HIV status -> biased estimate of incident HIV infection • Measuring more variables is not enough Sex, Age Seen at CHC= HIV status measured Final HIV Status
And improving your study design in response…. • Solution- Track a random sample of subjects not seen at CHC and measure HIV status • Now can recover unbiased estimate of HIV incidence for each community • Requires adjustment for CHC attendance Sex, Age HIV status measured Track random sample of non-returnees Final HIV Status Seen at CHC
Examples: • Community randomized trial (SEARCH) • Non –randomized roll out of a national program (PMTCT) • Using time series surveillance data for evaluation (CVL) • Modifying factors over time in a randomized trial (SHAZ!)
Community Randomization Example: SEARCH (Sustainable East Africa Research for Community Health) Cluster randomized trial to test whether universal ART regardless of CD4 count can improve health, educational, and economic outcomes CHC CHC CHC CHC CHC Efficient Community Cohort (ECCO) Year 1 Year 2 Year 5 Year 3 Year 4 Community Health Campaigns (CHC): HIV Testing/Linkage Intervention Communities: ART at all CD4 counts 16 communities n = 10,000 each Community Health HIV incidence Mortality Community viral load ART resistance AIDS Maternal/child health TB incidence Process Linkage to Care Time to ART start Retention in Care Community Productivity Workforce participation Child labor prevalence Agri/Fishing output Household income Educational attainment Healthcare utilization Repeated CHC’s obtaining individual-level linked data Outcomes Evaluation Control Communities: ART via country guidelines (CD4<350) 16 communities n = 10,000 each
Example: SEARCH • Causal Inference Question: • What would the HIV incidence be if all communities implemented immediate ART for all HIV positives vs. all communities implementing ART at <350? • Factors affecting implementation • Clinic capacity in the communities • Commitment of health service workers • Logistics/resource issues • Factors affecting outcome assessment • Migration between communities • Losses to follow up -Ascertainment of non-returnees (10% sample)
Example: PMTCT Intervention in Zimbabwe • PMTCT country-wide initiative • Zimbabwean Ministry of Health/ Elizabeth Glaser Pediatric AIDS Foundation • Focused on multiple steps of cascade • No evaluator control over where/how rolled out • Expect heterogeneity in when and how clinics implement • Outcome: HIV free survival among 9-18mo infants • Design: Serial cross sectional surveys • Mother-infant pairs sampled from catchment areas of 141 clinics pre-intervention and post intervention • Additional clinic and individual level data on uptake of intervention components, process/outcome, individual interactions with health care system
Example: PMTCT • Causal question: How do vertical transmission rates differ as a function of implementation of the PMTCT program? • Factors affecting implementation • Timing of roll out • Size of clinic/community served • Prevalence in the community/health of the mothers • Commitment/training of health service workers • Logistics/resource issues – location of clinics • Factors affecting outcome assessment • Quality of clinic records • Migration between communities • Losses to follow up
Measuring Impact Example: Community Viral Load Das-Douglas, CROI 2009 • A population-based measurement of a community’s viral burdenreflective of the aggregate HIV transmission risk • Community Viral Load is a biologic indicator: • Antiretroviral treatment effectiveness • HIV Prevention effectiveness • Engagement and retention in care • Passive surveillance of clinical laboratories and active surveillance of care providers