Download

1 / 79
790 likes | 794 Views
This document contains the meeting minutes for the Evaluation Subcommittee meeting held on October 5, 2016. It includes the agenda, suggested edits, and updates on various healthcare metrics.

E N D
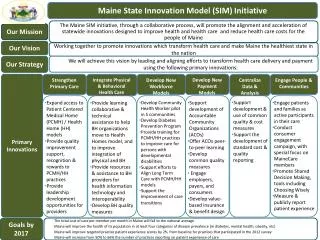
Maine SIM Evaluation Subcommittee October 2016 October 5, 2016
Meeting Minutes Please see meeting minute handouts for September • Suggested edits from Committee members? • Additional questions or clarifications? • Motion to approve as written or amended
All-Cause Readmissions (2012Q2 – 2016Q1) • All groups experienced an increase in readmission rates between 2012 and 2013 before decreasing to rates slightly above the target in 2015-2016. • Readmissions will have to continue to decrease to meet 13% target.
All-Cause Readmissions (2012Q2 – 2016Q1) • All groups experienced an increase in readmission rates between 2012 and 2013 before decreasing to rates slightly above the target in 2015-2016.
HbA1c Diabetic Care (2012Q2 – 2016Q1) • All groups experienced a decreasing trend away from the diabetic care target between 2012 and 2016. • Trend will have to reverse to achieve goal of 91% diabetic care.
Non-Emergent Emergency Department Use (2012Q2 – 2016Q1) • All groups decreasing over time and approaching target of 110.
Per Member Per Month Cost (2012Q2 – 2016Q1) • PMPM is remaining steady across time for all groups. • PMPM for the HHB group is considerably higher than other groups. • Note: PMPM includes only payments captured in claims data.
Consumer Interviews – Methodology • A random sample of MaineCare enrollees was identified and stratified by their current involvement in key interventions (HH, BHH, and Accountable Communities). • Each intervention group was further stratified by adult and child enrollees. • Consumers were sent an initial survey invitation letter and then contacted by phone. Those who could not be reached by phone were mailed a paper copy of the survey to complete. • A goal of 1,500 completed surveys was set. The sample contained 9,504 cases, of which 4,657 were used during data collection. • Data Collection began on July 7, 2016 and was completed by September 16, 2016.
Consumer Interviews – Completes by Intervention Group and Method of Contact
Consumer Interviews – Methodology Telephone Survey • 1,357 surveys were completed by telephone. Mail Survey • 147 surveys were completed by mail.
Consumer Interviews – Methodology • Raked weighting was performed to account for survey non-response and the sample design. • This allows the findings of a sample survey to be generalized across the entire population. In this survey, raked weight normalized the sample: • By Intervention group • Within each group by age, gender, and health district • The overall margin of error is plus or minus 2.8% • Margin of Error is the estimated amount by which a value found in a sample population is likely to deviate from the value which would be found if a census of the entire population was conducted. • For example, in this survey a value presented at 50% is likely to be at 47.2% or 52.8% if a census were conducted. • All margins of error in this survey are calculated at the 95% confidence interval
Consumer Interviews – Understanding Composites and Domains • Composite measures (also known as reporting composites), combine results for closely-related items that have been grouped together. • Psychometric analyses also indicate that they are reliable and valid measures of patients’ experiences • Composites ranged from 1 to 5 items • Questions are generally asked on a frequency scale (Always, Usually, Sometimes, Never) • They are calculated for Accountable Communities and Stage A Health Homes • Domains are a similar to Composites and are also valid measures of aspects of the patient experience. • Domains range from 3 to 9 items • Questions are asked on a five-point agree/disagree scale • Domains are calculated for Stage B Behavioral Health Homes
Consumer Interviews – Calculating Composites and Domains • Composite and Domain scores were calculated when a consumer had answered at least 50% of the questions in the measure. • For Composite scores: • Each response category was assigned a score between 0 and 100 based on the number of available responses • For example, “Always” is assigned a value of 100 and “Never” a value of 0 • The scores from all questions in the measure were added and then divided by the number of questions, resulting in a composite score between 0 and 100 • These scores were averaged together across all qualifying respondents to produce the final composite score • For Domain scores: • The “Strongly Agree” and “Somewhat Agree” categories for each question were combined • The reported domain score is the percent of individuals responding that they agree to a majority of the questions in the domain
Composite and Domain Results: Comparing 2015 to 2016 Circled values represent significant changes from 2015.
Stage B Behavioral Health Homes Domains: 2015 and 2016 Results
Composite and Domain Summary In general, patients are reporting a more positive experience in 2016 as compared to 2015. • There has been an increase in composite scores among both the Accountable Communities and Stage A Health Homes. • There has also been an increase in domain scores among the Stage B Behavioral Health Homes.
Individual Questions by Topic Areas In the following section, questions are grouped by topic areas. Any question for which no bar appears for an intervention group was a question which was not asked of that group.
Patient Provider Communications Providers Giving Information to Patients
Providers Giving Information to Patients % indicating positive answer
Providers Giving Information to Patients % indicating positive answer
Providers Giving Information to Patients (Stage B) % indicating positive answer
Giving Information to Patients Summary • Rated most positively: • Did this provider give you enough information about what you needed to do to follow up on your child’s care? • Were you given as much information as you wanted about what you could do to manage your child’s condition? • Rated least positively: • In the last 12 months, did you and anyone in this provider’s office talk about your child’s learning ability? • Differences exist between interventions: • Did this provider tell you that you needed to do anything to follow up on the care your child got during the visit? (Stage A compared to AC)
Giving Information to Patients Summary • In general, patients are more positive in 2016 compared to 2015 • Most positive changes 2015 to 2016: • In the last 12 months, did you and anyone in this provider's office talk about the kinds of behaviors that are normal for your child at this age? (Stage A: 62% to 74%) • In the last 12 months, did you and anyone in this provider's office talk about how much time your child spends on a computer and in front of a TV? (AC: 66% to 77%) • Where patients are less positive in 2016: • Did this provider tell you that you needed to do anything to follow up on the care your child got during the visit? (AC: 53% to 46%; Stage A: 67% to 62%) • In the last 12 months, did you and anyone in this provider's office talk about your child's learning ability? (AC: 50% to 45%)
Patient Provider Communications Does the Provider Explain Clearly?
Does the Provider Explain Clearly? % indicating positive answer
Does the Provider Explain Clearly Summary • Patients rate this area very positively • In general, patients are as positive in 2016 compared to 2015 • Where patients are less positive in 2016: • Staff speak with my family in a way that we understand. (Stage B: 100% to 90%)
Patient Provider Communications Does the Provider Listen and Seek Input?
Does the Provider Listen and Seek Input? % indicating positive answer
Does the Provider Listen and Seek Input? (continued) % indicating positive answer
Does the Provider Listen and Seek Input? (continued) % indicating positive answer
Does the Provider Listen and Seek Input? (continued) % indicating positive answer
Does the Provider Listen and Seek Input? (continued) % indicating positive answer
Does the Provider Listen and Seek Input Summary • Rated most positively: • How often did this provider listen carefully to you/your child? • My provider clearly understands the things that really matter to me about my/my child's health care • Stage B Behavioral Health Homes • Rated least positively: • Did anyone in this provider’s office ask you if there are things that make it hard for you to take care of your/your child's health? • Did you and anyone in this provider’s office talk about a personal problem, family problem, alcohol use, drug use, or a mental or emotional illness? • Did you and this provider talk about starting or stopping a prescription medicine? • Differences exist between interventions: • How often did this provider ask you for your ideas about managing your child’s health? (Stage B compared to AC and Stage A) • Is your child able to talk with providers about his or her health care? (Stage A compared to AC) • Did you and anyone in this provider's office talk about how much or what kind of exercise your child gets? (Stage A compared to AC)
Does the Provider Listen and Seek Input Summary • In general, patients are more positive in 2016 compared to 2015 • Most positive change 2015 to 2016: • Is your child able to talk with providers about his or her health care? (AC: 56% to 71%) • Thinking about the last 6 months, how often did this provider (the people providing counseling or treatment) ask you for your ideas about managing your child's health? (Stage A: 56% to 72%) • I, not staff, decide my treatment goals. (Stage B: 84% to 91%) • Where patients are less positive in 2016: • In the last 12 months, did you talk with this provider about any health questions or concerns (you had about your child's health)? (Stage A: 88% to 80%) • In the last 12 months, did you and anyone in this provider's office talk about a personal problem, family problem, alcohol use, drug use, or a mental or emotional illness? (Stage A: 50% to 45%) • I am frequently involved in his/her treatment. (Stage B: 100% to 94%)
Coordination of Care Need for Coordination of Care
Need for Coordination of Care In the last 12 months…
Coordination of Care Help Coordinating Care
Help Coordinating Care In the last 12 months… % indicating positive answer
Help Coordinating Care % indicating positive answer
Help Coordinating Care Summary • Rated most positively: • How often did you get the help you thought you needed from your primary care provider’s office to coordinate your/your child's care among these different specialists and services? • How often did you get the help you thought you needed from your primary care provider’s office to coordinate your/your child's care with the people you went to for counseling or treatment? • Rated least positively: • Were you given information about different kinds of counseling or treatment that are available? • Differences exist between interventions: • How often did you get the help you thought you needed from your primary care provider’s office to coordinate your/your child's care among these different specialists and services? (AC compared to Stage A) • How often did you get the help you thought you needed from your primary care provider’s office to coordinate your/your child's care with the people you went to for counseling or treatment? (Stage A compared to AC)
Help Coordinating Care Summary • In general, patients are more positive in 2016 compared to 2015 • Most positive change 2015 to 2016: • In the last 12 months, how often did you get the help you thought you needed from your primary care provider's office to coordinate your/your child's care among these different specialists and services? (AC: 75% to 97%) • Where patients are less positive in 2016: • In the last 12 months, were you given information about different kinds of counseling or treatment that are available? (Stage A: 86% to 80%)