Download
1 / 1
30 likes | 168 Views
Introduction. Conclusions. Results. ALTERNATING TENDENCY IN THE INTENSITY OF THE MADDEN-JULIAN OSCILLATION Kyong-Hwan Seo + , Jae E. Schemm + and Charles Jones* + Climate Prediction Center, NCEP/NWS/NOAA, Camp Springs, Maryland

E N D
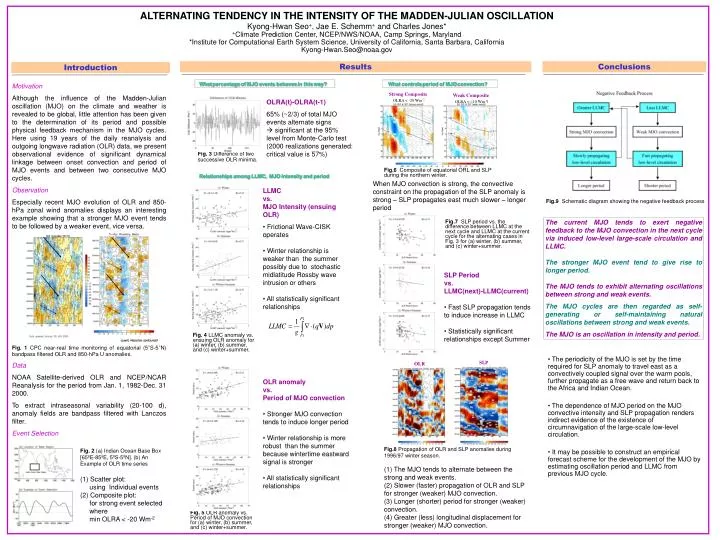
Introduction Conclusions Results ALTERNATING TENDENCY IN THE INTENSITY OF THE MADDEN-JULIAN OSCILLATION Kyong-Hwan Seo+, Jae E. Schemm+ and Charles Jones* +Climate Prediction Center, NCEP/NWS/NOAA, Camp Springs, Maryland *Institute for Computational Earth System Science, University of California, Santa Barbara, California Kyong-Hwan.Seo@noaa.gov What percentage of MJO events behaves in this way? What controls period of MJO convection? Motivation Although the influence of the Madden-Julian oscillation (MJO) on the climate and weather is revealed to be global, little attention has been given to the determination of its period and possible physical feedback mechanism in the MJO cycles. Here using 19 years of the daily reanalysis and outgoing longwave radiation (OLR) data, we present observational evidence of significant dynamical linkage between onset convection and period of MJO events and between two consecutive MJO cycles. Observation Especially recent MJO evolution of OLR and 850-hPa zonal wind anomalies displays an interesting example showing that a stronger MJO event tends to be followed by a weaker event, vice versa. Fig. 1CPC near-real time monitoring of equatorial (5°S-5°N) bandpass filtered OLR and 850-hPa U anomalies. Data NOAA Satellite-derived OLR and NCEP/NCAR Reanalysis for the period from Jan. 1, 1982-Dec. 31 2000. To extract intraseasonal variability (20-100 d), anomaly fields are bandpass filtered with Lanczos filter. Event Selection Strong CompositeOLRA < -20 Wm-2 Weak CompositeOLRA < |-10 Wm-2| OLRA(t)-OLRA(t-1) 65% (~2/3) of total MJO events alternate signs significant at the 95% level from Monte-Carlo test (2000 realizations generated: critical value is 57%) Fig. 3 Difference of two successive OLR minima. Fig.6 Composite of equatorial ORL and SLP during the northern winter. Relationships among LLMC, MJO intensity and period When MJO convection is strong, the convective constraint on the propagation of the SLP anomaly is strong – SLP propagates east much slower – longer period LLMC vs. MJO Intensity (ensuing OLR) • Frictional Wave-CISK operates• Winter relationship is weaker than the summer possibly due to stochastic midlatitude Rossby wave intrusion or others • All statistically significantrelationships Fig.9 Schematic diagram showing the negative feedback process The current MJO tends to exert negative feedback to the MJO convection in the next cycle via induced low-level large-scale circulation and LLMC. The stronger MJO event tend to give rise to longer period. The MJO tends to exhibit alternating oscillations between strong and weak events. The MJO cycles are then regarded as self-generating or self-maintaining natural oscillations between strong and weak events. The MJO is an oscillation in intensity and period. Fig.7 SLP period vs. the difference between LLMC at the next cycle and LLMC at the current cycle for the alternating cases in Fig. 3 for (a) winter, (b) summer, and (c) winter+summer. SLP Period vs. LLMC(next)-LLMC(current) • Fast SLP propagation tends to induce increase in LLMC • Statistically significant relationships except Summer Fig. 4 LLMC anomaly vs. ensuing OLR anomaly for (a) winter, (b) summer, and (c) winter+summer. • The periodicity of the MJO is set by the time required for SLP anomaly to travel east as a convectively coupled signal over the warm pools, further propagate as a free wave and return back to the Africa and Indian Ocean. • The dependence of MJO period on the MJO convective intensity and SLP propagation renders indirect evidence of the existence of circumnavigation of the large-scale low-level circulation. • It may be possible to construct an empirical forecast scheme for the development of the MJO by estimating oscillation period and LLMC from previous MJO cycle. SLP OLR OLR anomaly vs. Period of MJO convection • Stronger MJO convection tends to induce longer period • Winter relationship is more robust than the summer because wintertime eastward signal is stronger • All statistically significant relationships Fig.8 Propagation of OLR and SLP anomalies during 1996/97 winter season. (1) The MJO tends to alternate between the strong and weak events. (2) Slower (faster) propagation of OLR and SLP for stronger (weaker) MJO convection.(3) Longer (shorter) period for stronger (weaker) convection.(4) Greater (less) longitudinal displacement for stronger (weaker) MJO convection. Fig. 2 (a) Indian Ocean Base Box[65ºE-85ºE, 5ºS-5ºN]. (b) An Example of OLR time series (1) Scatter plot: using Individual events (2) Composite plot: for strong event selected where min OLRA < -20 Wm-2 Fig. 5 OLR anomaly vs. Period of MJO convection for (a) winter, (b) summer, and (c) winter+summer.