Download
1 / 33
390 likes | 1.25k Views
Topic 7. Pharmacodynamics : Dose-response relationship. 713 311 PRINCIPLES OF VETERINARY PHARMACOLOGY Dr. Korawuth Punareewattana . Faculty of Veterinary Medicine, Khon Kaen University. Pharmacodynamics (เภสัชพลศาสตร์). Pharmacodynamics (PDs) is the science of drug action on the body or

E N D
Topic 7 Pharmacodynamics: Dose-response relationship 713 311 PRINCIPLES OF VETERINARY PHARMACOLOGY Dr. Korawuth Punareewattana Faculty of Veterinary Medicine, Khon Kaen University
Pharmacodynamics(เภสัชพลศาสตร์) • Pharmacodynamics (PDs) • is the science of drug action on the body or • on microorganisms and other parasites within or on the body • PDs study can be performed on many levels • Molecular level • Cellular level • Tissue or organ level • Whole body level
Pharmacodynamics Pharmacodynamics consists of 2 elements • The relationship between drug concentration and effect • Mechanisms of drug action • Receptor mediated (major) • Signal transduction and Second messengers • Non-receptor mediated (minor)
Some terms involved • Mechanism of action • กลไกการออกฤทธิ์ • Pharmacological effect • ฤทธิ์ทางเภสัชวิทยา • Side effect • ผลข้างเคียง • Adverse effect • ผลเสียของยา, ฤทธิ์ไม่พึงประสงค์ • Undesirable effect • Unwanted effect • Toxic effect • พิษของยา • Receptor ตัวรับยา • Affinity สัมพรรคภาพ • แรงดึงดูดระหว่างยาและตัวรับยา • Efficacy ประสิทธิภาพของยา • Intrinsic activity • Potency ความแรงของยา • Ligand • ยา หรือ สารประกอบ ที่จับกับ receptor • Agonist • Partial agonist • Antagonist
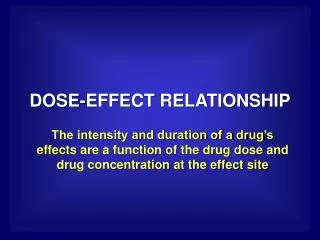
Pharmacodynamics Dose-Response Relationship • The intensity and duration of a drug’s effects are a function of the drug dose and drug concentration at the effect site
Monitoring Dose-Response • Level • Molecular (e.g, enzyme inhibition) • Cellular (in vitro tissue culture, blood cells) • Tissue or organ (in vitro or in vivo) • Organism • Endpoint used to measure effect may be different at each level • Overall effect = sum of multiple drug effects and physiological response to drug effects
Endpoints to Monitor Drug Effect Farnesyltransferase Inhibitors for Cancer
Dose-Response Endpoints Graded • Continuous scale (dose ® effect) • Measured in a single biologic unit • Relates dose to intensity of effect Quantal • All-or-none pharmacologic effect • Population studies • Relates dose to frequency of effect
Graded Dose ResponseexampleErythropoietin and Anemia(Linear dose-response plot) Peak Hematocrit Increment [%] Erythropoietin Dose [units/kg] Eschbach et al. NEJM 316:73-8, 1987
Maximal effect • [Drug] Effect = KD + [Drug] Drug-Receptor Interactions Drug Drug-Receptor Complex Ligand-binding domain k1 Effector domain k2 Receptor Effect (KD = k2/k1)
[Drug] KD + [Drug] [Drug] Maximal effect Effect = KD + [Drug] Effect = Maximal effect if [Dose] >> KD Maximal effect • [Drug] Effect = KD + [Drug] Dose-Effect Relationship
Emax Model • E is the drug effect • Conc is the conc at the receptor • Emax is the maximum drug effect • EC50 is the conc at 50% of Emax
Emax EC50 Graded Dose-Effect Curve(Linear dose-response plot)
Emax EC50 Log Transformation Log Dose-Response Curve (LDR plot)
Emax Model Predictions EC20 EC80 • Emax = 100 • EC50 = 1 • E0 = 0 (baseline)
Properties of Log-Dose Response (LDR) Curves • Describing the LDR-relationship over a wide range of doses • Typically S-shaped or “sigmoidal” • Frequently the same effect is produced by different drugs with an identical or at least similar mechanism. • In such cases the LDR-curves of the drugs may be expected to run parallel to each other. • Example from the next slide. • The curves of drug A and B are parallel. At the same height or response of the plot, the dose of drug B will be twice as great as that of drug A.
LDR and Identification of the site of drug action Theophylline Dose-Effect Relaxation % Control PDE Inhibition Theophylline [µM] Rabe et al. EurRespir J 8:637-42, 1995
Dose-Effect Parameters • Graded dose-effect curves are also a good way to compare agents that produce the same effect. • Drugs that produce the same effect differ in terms of potency and efficacy, which are parameters that can be assessed from the dose-response curves of the agents. The sensitivity of an organ or tissue to the drug POTENCY: EFFICACY: The maximum effect
Efficacy and Potency EFFICACY: The maximum effect POTENCY: The sensitivity of an organ or tissue to the drug
LDR and Type of ligandsReceptor-Mediated Effects % Maximum Effect [Drug]
Drug Interactions • Graded dose-effect curves are also useful for studying pharmacodynamic drug interactions. • This plot shows the dose-effect curves for an agonist alone, in yellow, • the agonist combined with a competitive antagonist in blue, and combined • with a non-competitive antagonist in green. • A competitive antagonist combines reversibly with the same binding site as • the agonist or active drug and can be displaced from the binding site by an • excess of the agonist. The maximal effect of the agonist can still be achieved • if sufficient agonist is used. • A competitive inhibitor lowers the potency of the agonist but • does not alter its efficacy. • A non-competitive antagonist binds irreversible to the receptor binding site or • interacts with other components of the system to decrease or eliminate the effect • of the drug binding to the receptor. A non-competitive antagonist prevents the agonist, • at any concentration, from producing its maximum effect. Typically, the dose response • curve with this type of antagonist reveals reduced apparent efficacy, • but the potency is not altered. • Using the dose-effect curve to study drug interactions can obviously be helpful in • elucidating the mechanism of the drug interaction.
Graded Dose-Effect Analysis • Identify the therapeutic dose/concentration • Define site of drug action (receptor) • Classify effect produced by drug-receptor interaction (agonist, antagonist) • Compare the relative potency and efficacy of drugs that produce the same effect • Assess mechanism of drug interactions
Quantal Dose-Effect Distribution ED50 # of Subjects Threshold Dose
Cumulative Dose-Effect Curve Cumulative % of Subjects Dose
ED90 = 490 mg ED50 = 400 mg Example LidocaineQuantal Dose-Effect % Achieving Complete Analgesia Total Lidocaine Dose (mg) Ferrante et al. Anesth Analg 82:91-7, 1996
Therapeutic and Toxic Effects Therapeutic Toxic % Responding ED99 TD50 TD1 ED50 Dose
TD50 TD1 ED50 ED99 = 1.3 Certain Safety Factor = TD1 - ED99 X 100 = 31% Standard Safety Margin = ED99 Therapeutic Indices Therapeutic Ratio = = 2.5
Antihypertensive Dose-Effect Identifying the dose-effect relationship is an important component of early clinical trials performed during the initial stages of drug development. Johnston Pharmacol Ther 55:53-93, 1992
Antihypertensive Drugs Desirable Dose Range Dose Range most often used % with Maximal Effect Adverse Effects Log Dose
Role of Dose-Effect Studies • Drug development • Site of action • Selection of dose and schedule • Potency, efficacy and safety • Drug interactions • Patient management • Therapeutic drug monitoring • Risk-benefit (therapeutic indices)