Download
1 / 27
270 likes | 277 Views
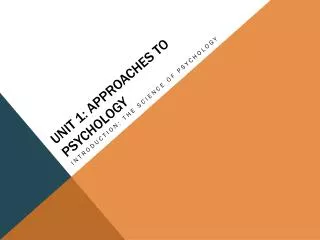
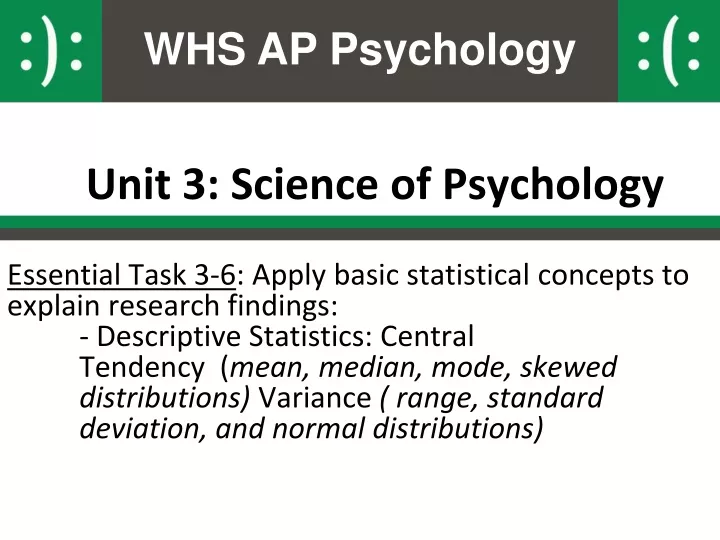
Unit 3: Science of Psychology. Essential Task 3-6 : Apply basic statistical concepts to explain research findings: - Descriptive Statistics: Central Tendency ( mean, median, mode, skewed distributions) Variance ( range, standard deviation, and normal distributions). Growth of Psych.

E N D
WHS AP Psychology Unit 3: Science of Psychology Essential Task 3-6: Apply basic statistical concepts to explain research findings: - Descriptive Statistics: Central Tendency (mean, median, mode, skewed distributions) Variance ( range, standard deviation, and normal distributions)
Growth of Psych Approachesto Psych The Science of Psychology Ethics ResearchMethods Statistics Sampling Descriptive Correlation Experiment Descriptive Inferential Naturalistic Observation Case Study Central Tendency Variance Survey Careers We are here
Essential Task 3-6: Outline • Descriptive Statistics: • Central Tendency • Mean, median, and mode • skewed distributions • Variance • Range • standard deviation • normal distributions
Statistical Reasoning Statistical procedures analyze and interpret data and let us see what the unaided eye misses. Composition of ethnicity in urban locales
Central Tendency Tendency of scores to congregate around some middle variable A measure of central tendency identifies what is average or typical in a data set
Measures of Central Tendency Mode:The most frequently occurring score in a distribution. Mean:The arithmetic average of scores in a distribution obtained by adding the scores and then dividing by their number. Median:The middle score in a rank-ordered distribution.
But the meandoesn’t work in a skewed distribution The Median is a much better measure of the center
Negatively Skewed Skewed distributions Positively Skewed
Measures of Variation • Statistical dispersion (how distributed the data points are) is a key concept in statistics. • Two key ways of measuring statistical dispersion • Range • Standard Deviation
Range • The range simply gives the lowest and highest values of a data set.
Standard Deviation • Standard deviation gives a measure of dispersion. • Essentially, they are measures of the average difference between the values. • Standard deviation gives a value that is directly comparable to your mean values.
Standard Deviation in Action A couple needs to be within one standard deviation of each other in intelligence (10 points in either direction). —Neil Clark Warren, founder of eHarmony.com
Normal Distributions • The distribution of data also gives us key info. • We know that many human attributes… • e.g height, weight, task skill, reaction time, anxiousness, personality characteristics, attitudes etc. • …follow a normal distribution.
IQ follows a Normal Distribution Mean = 100 SD = 15
What percentage score below 100? Mean = 100 SD = 15
What percentage score below 100? Mean = 100 SD = 15
What percentage score above 100? Mean = 100 SD = 15 34.1% + 13.6% + 2.1%
What percentage score between 85 and 100? Mean = 100 SD = 15 34.1%
What percentage score between 85 and 115? 34.1% + 34.1% = 68.2% Mean = 100 SD = 15
What percentage score between 70 and 130? Mean = 100 SD = 15 13.6% + 34.1% + 34.1% + 13.6% = 95.4%
What percentage score below 70 and above 130? Mean = 100 SD = 15
Figure 6. The distribution of IQ scores in male and female populations.Adjusted parameter values yielded a male-female gap of 0.162 SD in g equivalent to 2.43 IQ points in favor of men Interpret this graph