Download
1 / 17
170 likes | 312 Views
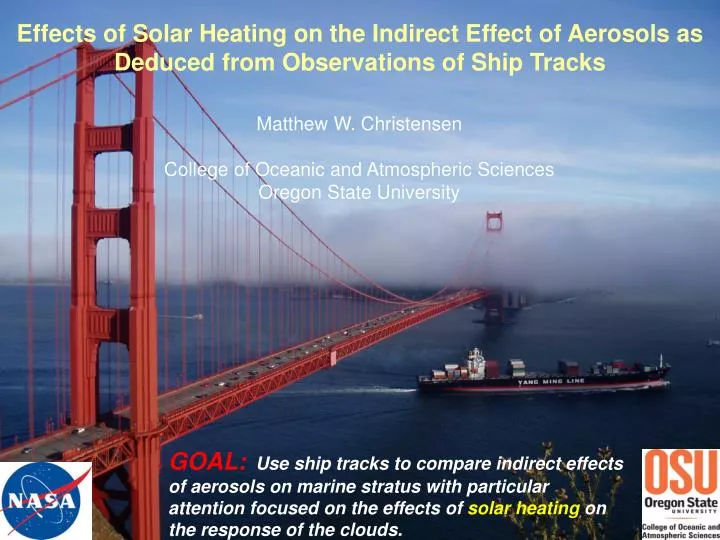
Effects of Solar Heating on the Indirect Effect of Aerosols as Deduced from Observations of Ship Tracks. Matthew W. Christensen College of Oceanic and Atmospheric Sciences Oregon State University.

E N D
Effects of Solar Heating on the Indirect Effect of Aerosols as Deduced from Observations of Ship Tracks Matthew W. Christensen College of Oceanic and Atmospheric Sciences Oregon State University GOAL:Use ship tracks to compare indirect effects of aerosols on marine stratus with particular attention focusedon the effects of solar heating on the response of the clouds.
Aerosol Effects in the Atmosphere Cloud Albedo Effect Semi-direct Effect Direct Effect Lifetime Effect More CCN = Higher Reflectivities also More CCN = More Clouds Figure 2.10 IPCC 4th Assessment Report
Visible Near Infrared Following Ship Tracks • Ship Track Formation • Low clouds in cold upwelling ocean regions. • Neutral stability. • Moderate winds in a shallow boundary layer. • Strong capping inversion. • Ship Track Evolution • Ship track length increases. • Ship track width increases (dispersion) • Ship tracks drift due to wind advection. • Tools • MODIS on Satellites Aqua and Terra • NCEP reanalysiswind vectors. • Mean cloud top height ~1km • 925 mb pressure-level winds July 28th 2001 1950 UTC (TERRA)
Ship Track Identification Afternoon Morning July 19th 2002 1840 UTC (Terra) July 19th 2002 2150 UTC (Aqua) • Track pairs were identified through visual inspection
Ship Track Identification Afternoon Morning July 19th 2002 1840 UTC (Terra) July 19th 2002 2150 UTC (Aqua) • Track pairs are identified through visual inspection. • Automated pixel identification as ship and controls.
Ship Track Identification Afternoon Morning July 19th 2002 1840 UTC (Terra) July 19th 2002 2150 UTC (Aqua) • Track pairs are identified through visual inspection. • Automated pixel identification as ship and controls. • NCEP wind field is used to predict the position of the Terra ship track at the time of the Aqua pass.
Ship Track Identification Afternoon Morning July 19th 2002 1840 UTC (Terra) July 19th 2002 2150 UTC (Aqua) • Track pairs are identified through visual inspection. • Automated pixel identification as ship and controls. • NCEP wind field is used to predict the position of the Terra ship track at the time of the Aqua pass. • 2nd order line fit to Aqua and predicted Terra positions
Ship Track Identification Afternoon Morning July 19th 2002 1840 UTC (Terra) July 19th 2002 2150 UTC (Aqua) • Track pairs are identified through visual inspection. • Automated pixel identification as ship and controls. • NCEP wind field is used to predict the position of the Terra ship track at the time of the Aquapass. • 2nd order line fit to Aqua and predicted Terra positions • Segment length ~30 km.
Ship Track Identification Afternoon Morning July 19th 2002 1840 UTC (Terra) July 19th 2002 2150 UTC (Aqua) • Track pairs are identified through visual inspection. • Automated pixel identification as ship and controls. • NCEP wind field is used to predict the position of the Terra ship track at the time of the Aqua pass. • 2nd order line fit to Aqua and predicted Terra positions • Segment length ~30 km. • Ship and control pixels showing retrieved droplet radius.
Droplet RadiusMorning clouds (Terra) Afternoon clouds (Aqua)OVERCAST CONDITIONS • Polluted clouds have smaller droplet radii than unpolluted clouds. • Droplets decrease in size throughout the day. • Decrease in size is less pronounced for polluted clouds. • Unpolluted clouds could be losing large droplets through drizzle more rapidly than evaporation of small droplets through enhanced entrainment for polluted clouds.
Optical DepthMorning clouds (Terra) Afternoon clouds (Aqua)OVERCAST CONDITIONS • Polluted clouds have larger optical depths than nearby unpolluted clouds. • Terra optical depths are larger than Aqua by ~11%. • Morning clouds are thicker than afternoon clouds. • Differences in optical depth between polluted and unpolluted clouds are ~ equal for morning and • afternoon.
Cloud Liquid Water AmountMorning clouds (Terra) Afternoon clouds (Aqua)OVERCAST CONDITIONS • Terra liquid water amounts are larger than Aqua by ~15% • morning clouds are thicker than afternoon clouds. • For overcast conditions, polluted clouds have less liquid water than nearby unpolluted clouds overlying free troposphere sufficiently dry that the increased entrainment in clouds • with smaller droplets leads to the drying of polluted clouds as suggested by results of LES model results reported by Ackerman et al. (2004). • Unpolluted clouds lose more liquid water than polluted clouds throughout the day. • approximately two thirds of this loss could be due to entrainment and solar heating with one third due to drizzle
Daytime Changes NTerra = 659 N = 237 NAqua = 545
Morning Observations Cloud Susceptibility • Cloud susceptibility is the increase in cloud • albedo resulting from the addition of 1 • [cloud droplet cm-3], keeping cloud liquid water • constant (Platnick and Twomey, 1994) • Clean clouds (low concentration of larger • droplets) will be more susceptible than polluted • clouds (high concentration of smaller droplets). • Change in reflectance is proportional to: • Morning clouds from this study were more susceptible to the ship pollution plumes than were the clouds taken from the ensemble averages. • Evidently the more susceptible clouds stand a better chance of showing up in the afternoon pass than the less susceptible clouds.
Satellite Viewing Geometry Terra and Aqua Does the viewing geometry of ship tracks common to both satellites affect the outcome? Relative Viewing Geometry Majority of segments were viewed In the region of backscattered sunlight • Remapped segments are constructed using the Terra observations nearest in satellite zenith angle to the Aqua viewing geometry. • Mean differences and standard errors of the means for Terra and Aqua are more than twice as large as the differences for the Terra and Remapped Terra. • Error incurred through viewing geometry is convincingly small. • Both Terra and Aqua observations show droplet radius growing towards the coast. • Terra observations • are consistent with the • Aqua observations Aqua: Afternoon Descending orbiter Terra and Remapped Terra Terra Sun Glint Backscattered Sunlight Aqua Sun Glint Terra: morning descending orbiter
Dynamics of Marine Stratocumulus Mixing Mechanisms 1) Cloud top radiative cooling. 2) Evaporation of droplets near cloud top. SYNOPTIC ANTICYCLONIC SUBSIDENCE Turbulent entrainment at cloud top INVERSION Decoupling Mechanisms 1) Daytime solar heating. 2) Evaporation of droplets below cloud base. Morning clouds coupled to the boundary layer tend to have larger entrainment rates than decoupled afternoon clouds. CLOUD TOP Microphysical interactions causing precipitation Evaporative cooling at cloud top Long wave radiation causing cooling at cloud top and heating cloud base CLOUD LAYER Solar radiation heating the body of the cloud Down and updrafts produce mixing h • Polluted vs. Unpolluted Clouds • 1) Polluted clouds have stronger evaporative cooling. • Larger entrainment rates (cloud top • drying) • 2) Precipitation is suppressed in polluted clouds. • Stronger coupling (cloud base • moistening) Warm updraft from cloud base CLOUD BASE Latent heat release Evaporative coolingbelow cloud base supporting stability Surface fluxes of heat and moisture SUBCLOUD LAYER Sea Adapted from Nieuwstadt and Duynkerke (1996)
Summary of Findings from Ship Tracks • Effects of Solar Heating on Cloud Properties • Overcast Conditions • Droplet radius, optical depth, and liquid water amounts decreased throughout the day. • Daytime decrease in droplet radius is greater for unpolluted clouds. • Daytime decrease in optical depth is approximately the same for both polluted • and unpolluted clouds. • Daytime decrease in liquid water amount is greater for unpolluted clouds. • Future Work • Increase the data base to include more ship track pairs. • Extend study for partly cloudy conditions. • Use geostationary observations to track diurnal changes in ship tracks.