Download
1 / 38
380 likes | 385 Views
This session explores various models and techniques for projecting age patterns of mortality, fertility, and migration. It covers the United Nations Model, the US Census Bureau Model, and the use of software packages like MORTPAK and Spectrum. Hands-on exercises using Excel templates are included.

E N D
Session 5:Projecting the age patterns of mortality, fertility and migration • Models and exercises
Projecting age patterns of mortality • Two approaches: • Project age patterns of mortality based on empirical trends. Level of mortality is implicit. • Project age patterns of mortality based on established trends of the level of mortality and determine an associated age pattern based on models.
Life expectancy 2005-2010 Session 04_Demographic Trends_Presentation.xlsx
Projecting age patterns of mortality I:United Nation Model The software package MORTPAK from the United Nations provides a program “MATCH”, which generates model life tables. MORTPAK.[MATCH]. The original United Nations model for projecting age patterns of mortality has been documented, but not published as a user-friendly tool. See the new updated and extended United Nations model life tables : http://esa.un.org/unpd/wpp/Model-Life-Tables/download-page.html
MATCH Two scenarios:User-defined a life table Using a model life table
Projecting age patterns of mortality II:US Census Bureau Model • The US Census Bureau has developed spreadsheets that interpolate life tables, one for each sex. The procedure interpolates between two “pivotal” life tables, based on the probabilities of dying n[nqx]: • INTPLTM Interpolation for life tables for males • INTPLTF Interpolation for life tables for females • Usually, the pivotal life tables are • An empirical life table for the base year of the projection • An ultimate (upper limit) life table • The spreadsheet generates a life table with a desired level of mortality that is between the life expectancies of the base and the ultimate life table. Repeated application of the procedure will generate a set of age-specific mortality rates [nmx] or probabilities of dying [nqx].
INTPLTM.xls/INTPLTF.xls • Input data for INTPLTM/INTPLTF • Table number [“Table 123”] • Country name and Year [“Poplandia: 1960 and 1980”] • Life expectancy at birth for life table 1 (base year) • Life expectancy at birth for life table 2 (ultimate life table) • Life expectancy at birth for desired life table • Lower limit of open-ended age group • Life expectancy for the open-ended age group, life table 1 • Life expectancy for the open-ended age group, life table 2 • Separation factor for age under 1, life table 1 • Separation factor for age under 1, life table 2 • Separation factor for ages 1-4, life table 1 • Separation factor for ages 1-4, life table 1 • Probabilities of dying by age nqx for life table 1 • Probabilities of dying by age nqx for life table 2
Projecting age patterns of mortality III:US Census Bureau RUPEX The US Census Bureau’s population projection program RUPEX has a built-in functionality that is similar to the spreadsheets INTPLTM and INTPLTF. The user needs to specify two pivotal life tables and, optionally, life expectancies for any year between the base and the last year of the projection. The projection program does the interpolation and adjustments automatically of the age-specific mortality values See on the companion CD: Arriaga (2012). Population Analysis with Microcomputers - Volume II - Extract B RUP.
Projecting age patterns of mortality IV:Spectrum Like RUPEX, Spectrum can generate internally age patterns of mortality based on tends of life expectancy and model life tables.
Hands-on exercise: Mortality patterns • Make yourself familiar with the Excel templates and the MATCH [MORTPAK] package • Use your national data for the exercise or use the test data from Session 4.
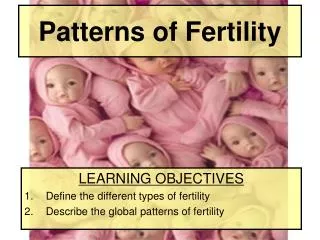
Projecting age patterns of fertility Overview
Projecting age patterns of fertility I:United Nation Model • Excel template UNPD_ASFR.xls • Using characteristic age-patterns of fertility associated with select levels of fertility, the model generates a series of age patterns by interpolating between a base pattern and a target pattern. • The template allows for extending the target pattern beyond the last year (target year) by keeping it constant.
ASFR vs. PASFR • Don’t forget that the UN model provides standardized age pattern, e.g. proportionate age-specific fertility rates. By multiplying each rate with the corresponding TFR, the ASFR are obtained.
Projecting age patterns of fertility II:US Census Bureau Model • The model in spreadsheet ASFRPATT.xls finds age patterns of fertility for a give level of fertility, based on typical age-specific fertility patterns in developing countries.
Hands-on exercise: Fertility patterns • Make yourself familiar with the Excel templates • Use your national data for the exercise or use the test data from Session 4.
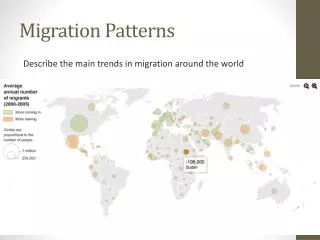
Projecting age patterns of Migration I:United Nation Model • Excel template UNPD_Migration Age Patterns.xlsm • The model generates typical age patterns of migration for net-migration. • The model estimates a typical sex ratio. • The user may select one of three typical patterns.
Projecting age patterns of Migration I:United Nation Model • Family migration
Projecting age patterns of Migration I:United Nation Model • Male Labor Migration(immigration)
Projecting age patterns of Migration I:United Nation Model • Female Labor Migration(immigration)
Hands-on exercise: Migration patterns • Make yourself familiar with the Excel template • Use your national data for the exercise or use the test data from Session 4.