Download
1 / 22
220 likes | 323 Views
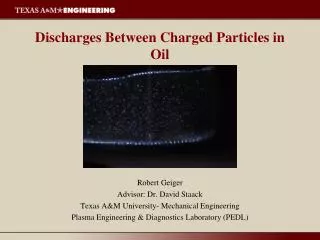
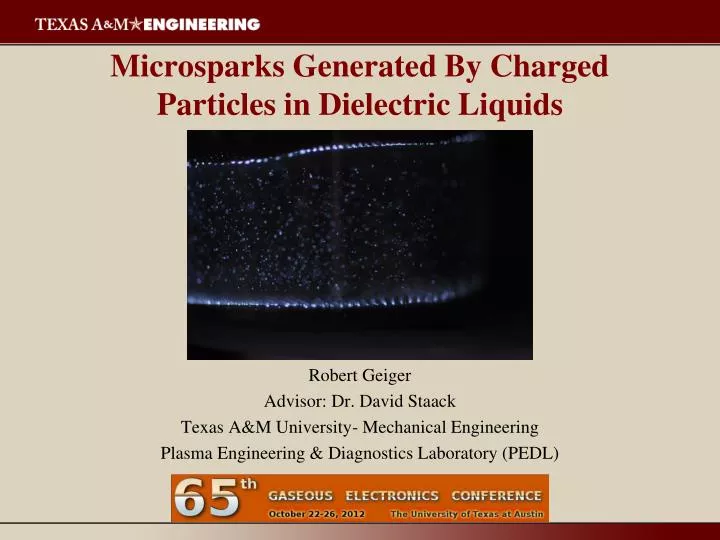
Microsparks Generated By Charged Particles in Dielectric Liquids. Robert Geiger Advisor: Dr. David Staack Texas A&M University- Mechanical Engineering Plasma Engineering & Diagnostics Laboratory (PEDL). Dielectric Medium – Extra Heavy Crude. Extra Heavy Oil. Plasma in Oil. Light Oil.

E N D
Microsparks Generated By Charged Particles in Dielectric Liquids Robert Geiger Advisor: Dr. David Staack Texas A&M University- Mechanical Engineering Plasma Engineering & Diagnostics Laboratory (PEDL)
Dielectric Medium – Extra Heavy Crude Extra Heavy Oil Plasma in Oil Light Oil Can plasma efficiently lower viscosity? Current Methods Hydrocracking Steam cracking
Low Energy Plasma in Liquids • Charcteristics • 1) Energy Per Pulse ~ C • 2) Stray Capacitance ~ 5 pF • 3) Lowest Energy ~ 1 mJ • Lower Energy • Smaller size • More non-equilibrium R Spark Gap 1 Spark Gap 2 Output C V Nano-second pulsed discharge from ~ 1μm tips. 5mJ/pulse 20J/pulse D. Staack, A. Fridman, A. Gutsol et al., Angewandte Chemie-International Edition, vol. 47, no. 42, pp. 8020-8024, 2008.
Low Energy Input – Charge Carrier Method HV GND (V ~ 5 – 30 kV) ball Electrode • Spherical Capacitor • C = 4πε0R • R ~ 0.5 – 5 mm • C ~ 0.05 - 0.5 pF • E ~ 0.5 – 200 μJ 2R Discharge
Experimental Setups Multiple Charge Carrier
4 s 6 s 12 s 14 s 20 s 0 s Discharge Modes for Multiple charge carriers: 1) Gas Bubble Chain Formation • High temperature gas phase • DC Mode Glow Discharge • Duration ~ 5 s • Ballasted • Energy Determined by discharge current 2) Spark Chain Formation • High temperature liquid phase • Transient Spark • Energy determine by External Capacitance • Duration ~ 10-100 ns 3) Microplasma Mode • Low temperature liquid phase • Power Density ~100 W/l
Multiple Charge Carrier - Batch Reactor Acrylic Top High Voltage (-13.3 kV) Micro-plasma Discharge Metal ball/ Charge Carrier O-rings ~50W/L Electrodes Oil Ground (-)
Difficulty Working with Heavy Crude • Mix Heavy and Light • Wasteful • Easy • Increase Temperature • Lose Light HC • Increase Conductivity • Difficult Composition Conductivity
Viscosity Results Heavy Oil Treated samples and controls measured using AR-2000 Rheometer.
Mass Fraction Boil Off Analysis • Input Electrical Discharge Energy (20 kJ, 24g) • 2.7% by mass converted to lights ( ~ 3.8x10⁻³ moles) • 1.43 kJ need to break C-C bonds • Efficiency 1.43 / 20 = 7% • About 7% of electrical energy goes into breaking C-C bonds • System has not been optimized Heavy Oil Decrease in Heavy HCs Increase in Light HCs
Summary • Interesting way to initiate nanosecond microsparks • Great control over discharge energy • Spark Gaps (mJ J) • Charge Carriers (uJ mJ ) • Control of plasma properties in liquids • Scaling is possible • Viscosity decreases were observed • Cracking to lighter hydrocarbons Future Work • High Temperature and Pressure • Effect of energy per pulse on chemistry
References Question? References: • Alyssa Wilson et al 2008 Plasma Sources Sci. Technol. 17 045001 • Ayato Kawashima et al, J. Appl. Phys. • D. Staack, A. Fridman, A. Gutsol et al., Angewandte Chemie-International Edition, vol. 47, no. 42, pp. 8020-8024, 2008. Acknowledgements: This material is based upon work suppoerted by the National Science Foundation Grant #1057175
Particle Dynamics – Contact Charging Field Enhancement Factor Lift off Voltage mg = qE g = qαV/d q = α CV α = (mgd/CV2)1/2 α ~ 1/β Experimental α ≈ 0.3 Charge relaxation τ = ε/σ For Mineral Oil ~ 0.5 s Liu, T. M.-C. (2010). The Design of a Micro/Nano-Particle Electrostatic Propulsion System.
Mixing Heavy and Light Oils Pure Heavy Crude ~ 188.4 Pa . s 70/30 mixture ~ 38.2 Pa . s Pure Light Oil ~ 0.0196 Pa . s
Discharge in Liquids - Process • Initiation Low Density Region • Electrolysis • Boiling (Joule Heating) • Electrostatic Cavitations • Breakdown • Primary Streamer • Secondary Streamer • Spark • Thermalization • Relaxation 1950s- present thoroughly studied breakdown process in transformer oils and DI water. Plasma’s properties less studied. Cathode (-) Anode (+) Gap ~ 6 cm
Discharges in Liquids - Initiation Assumptions: All initiation mechanism achieve a low density reduction n Const (I) and (V) δ – initial pertubation size r Local Low Density Region (n) Boiling Analysis (Energy Balance) Electrolysis Analysis ( Faradays law of electrolysis) Y = (Yeild of Fluid) Electrostatic Cavitation Analysis (Force Balance) Cavitation Electrode should be larger Fluid
Bubble Formation Time Estimates Microbubble can be generated most quickly by cavitation and even by other methods as conditions similar to experiments. V = 10 kV Rtip = 1 μm ne = 1012 cm-3 I= 10 nA V = 10 kV Rtip = 5 μm ne = 1016 cm-3 I= 350 mA
Experimental Setups Single Charge Carrier Resistor Dielectric Liquid Power Supply Multiple Charge Carrier