Download
1 / 11
120 likes | 311 Views
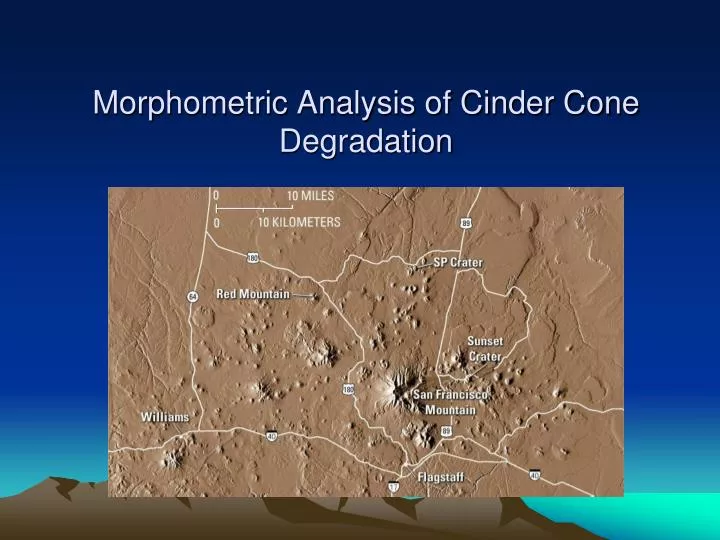
Morphometric Analysis of Cinder Cone Degradation. Summary. Cinder cone measurements are used to determine morphological effects and rate of degradation. San Francisco volcanic field, Arizona radiometric dates and stratigraphic studies determined cone ages

E N D
Summary • Cinder cone measurements are used to determine morphological effects and rate of degradation. • San Francisco volcanic field, Arizona • radiometric dates and stratigraphic studies determined cone ages • decrease in height, height/width ratio and slope through time • Crater diameter to cone basal diameter ratio does not appear to change with degradation • Morphometric degradation patterns are similar for all cinder cones • Based on information from Nevada, Oregon, Manchuria, Italy and Reunion • Temperature and rainfall greatly effect rate of degradation • Initial cinder cone geometry starts very similar with all cinder cones • Degraded cones can then be used to determine long term climate changes • Degradation modeled for 2 cases • Burial from lava flows • Reduces basal diameter • Erosion and mass wasting • Tends to increase basal diameter due to deposition of eroded materials • Primary process is mass wasting • “cinders weather to clay, which is gullied by rainfall, with the debris sliding downslope” • Mass wasting processes can be used to create a degradation curve
Located in northern Arizona, Flagstaff Hundreds of cones with varying degradational states Basaltic to andesitic to benmoreite (alkalic) Lots of geological information Maps Radiometric dates Chemical analyses San Francisco Volcanic Field
Colton Classification • Colton classified cinder cones into 5 categories based on degradation • Stage 5 • Youngest, steep, lack gullies, little oxidation • Stage 4 • Lack large scale erosion, oxidation significantly decompsed cinders to clay, sparse vegetation • Stage 3 • Gullies • Stage 2 • Severe erosion, inner dikes and ridges visible, subdues rim, vegetation in good soil • Stage 1 • Complete strippage of material leaves a plug
Conclusion • 1) Cone heights, height/diameter ratios, and slopes decrease with degradation • Ability to roughly date cones based on morphology • 2) Crater diameter/basal diameter ratios (Wcr/Wco) appear to be nearly independent of degradation, and thus may be a useful index of cone origin • 3) Erosion and mass wasting account for the majority of morphological changes • Wind has little effect unless there is substantial ash cover • Lava flows have little change compared to erosion • 4) Degradation rate decreases with cone size as well as age • 5) Due to climate, erosion rates vary depending on location • With time spans of several million years, measurements of cone morphology can be used to determine past climate