Download
1 / 29
320 likes | 530 Views
The Effects of Green Energy Policies on Innovation. By Ryan Prescott. Renewable Energy. Six Sources of Renewable Energy Hydro Power Wind Power Geothermal Oceanic Power Wave Tidal Biomass Solar Photovoltaic Solar Concentration. Wind Power.

E N D
The Effects of Green Energy Policies on Innovation By Ryan Prescott
Renewable Energy Six Sources of Renewable Energy • Hydro Power • Wind Power • Geothermal • Oceanic Power • Wave • Tidal • Biomass • Solar • Photovoltaic • Solar Concentration
Wind Power • 1980’s major advances in aerodynamics, structural design and resource assessment. • By 2007, installed global wind generating capacity had increased to 94,124 MW from 10 MW in 1980(Earth Policy Institute, 2008).
Geothermal • Geothermal energy comes from the harnessing of super heated underground aquifers or reservoirs. • The number of countries utilizing geothermal energy has increased from 10 in 1975 to 24 in 2004 (IEA/OECD, 2006). • From 1984 to 2004 capital cost for geothermal power decreased 50% (IEA/OECD, 2006).
Wave • There have been several different approaches used to capture wave energy. • An oscillating water column which consists of a partially submerged structure where air is trapped above the water free surface. • Palemis, a floating cylindrical snake like device.
Tidal • The most basic tidal power is a turbine in the water, whereby the tide rotates the turbine producing power. • Barrage tidal power is where a barrage or dam is placed across an estuary. • Currently there is no clear winner in oceanic technology. • 260 MW of tidal barrages worldwide (International Energy Agency, 2006).
Biomass There are several ways to produce bioenergy. • Anaerobic digestion • Involves the breaking down of biodegradable material using microorganisms in the absence of oxygen to produce methane and carbon dioxide rich biogas. • Combustion • Biomass such as wood or wood pellets co-fired with coal or used in large combustion plants.
Biomass Continued • Prylosis • Biomass is converted to liquid (bio-oil), gaseous and solid (charcoal) through the super heating of the biomass in the absence of oxygen. • Fermentation • The converting of sugars from such sources as corn, sugarcane or sugar beet into ethanol and another byproduct such as methane using microorganisms. • Biomass supplies over 50% of the renewable energy supply of the world (International Energy Agency, 2006).
Photovoltaic • Photovoltaics involves the use of sunlight to split positive and negative charge carriers which produce an electrical voltage. • The worldwide use of PV has increased substantially with installed capacity increasing from 110 MW in 1992 to 1809 MW in 2003 (International Energy Agency, 2006). • Capital costs have fallen substantially from the 70’s when it cost several hundred dollars per watt to less than 6 dollars per watt (Anderson, 1998).
Solar Concentration • Solar concentration involves the concentration of the sun’s rays to produce either a super-heated liquid or gas. • Several different designs have been proposed such as parabolic troughs and tower plants. • OECD countries produced 548 GWh of electricity in 2003 (International Energy Agency, 2006).
Cost of Power (Gross et al, 2003)
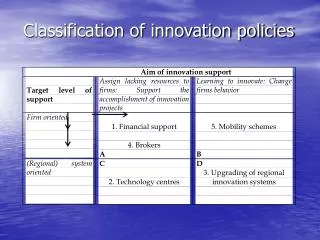
Types of Policies for Encouraging Growth and Innovation in Green Energy • Price guarantees or feed-in-tariffs • Pollution Permits • Obligations • Investment Incentives • Research Subsidies
Why Encourage Research and Innovation in Green Energy Technologies? • Spillovers associated with research • Decreasing of the pollution externality caused by traditional energy sources such as: • Coal • Oil • Natural Gas
Literature Review Literature Related to Innovation in Green Energy • Spillovers resulting from R&D • There are many estimates of the social returns to R&D • Grilches (1992) reviews empirical evidence showing that private rates of return on R&D have been significantly less than social rates of return. • Simple measurement of improvement, such as increased crop yield. • Regression based estimations using patent citations, looking at how patents in one sector are cited by patents in another sector.
Literature Review Continued • Induced innovation • Induced innovation as a result of energy price changes has been looked at by several authors. • Popp (2002) uses US patent and trademark office data to look at the effect of energy prices on energy efficiency innovations. • Innovation as a result of government policy choices has been looked at by several others. • Popp (2006) used patent data on patents filed by the US, Germany and Japan in their home countries to look at innovation spillovers. • Johnston et al (2008) looked at the effect of policy changes within most industrialized nations on innovation using country patent counts.
Problem Statement • Inefficient investment in Green Energy R&D. • Mechanism to increase innovation complicated by market structure. • Markets not perfectly competitive. • Must account for different stages of competition. • Renewable energy firms compete amongst other renewable energy firms to innovate new products. • Renewable energy firms compete against traditional energy firms to supply energy to the market. • Firms from different countries face different incentives to innovate.
Research Objectives • Develop theoretical model. • From the model develop testable hypothesis. • Collect data and test hypothesis empirically.
Stage 2 Countries m and n Pi(Q) = αi – βiQ Q = qti+ qri i = m,n Pri(Q) = siPti(Q) • If si>1 then there is feed-in-tariff or price guarantee. • A renewable (r) firm from country m competes against a traditional firm and solves the domestic maximization problem:
Stage 2 Continued • A renewable (r) firm from country m competes against a traditional firm and solves the international maximization problem: • δ measures the openness of an economy to an international firm. • αn = αm = α, βn = βm = β and ctn = ctm = ct
Stage 1 • Firm i’s probability of discovering the new technology P(xi) and satisfies: 0 ≤ P(xi) ≤ 1 i=m,n P′(xi) > 1/k P′′(xi) = 0 • If two firms discover at the same time then the winner is determined by a coin flip. Pr(firm i is the winner) = Pr(firm i discovers)Pr(firm j doesn’t discover) + 0.5 Pr(firm i discovers)Pr(firm j discovers)
Stage 2 Continued • Both firms have the same quadratic R&D cost function: where 0 ≤ φ ≤ 1 φ = 1 no subsidy • πm* is the profit that the renewable winner from country m will receive with the patent. • πm* is exogenous and determined from stage 2.
Theoretical Results • Result 1: Increase in feed-in-tariffs or price guarantees increases the research of both domestic and international firms equally provided it is an open economy (δ=0) and research subsidies are equal • (φm= φn). • Result 2: If economies aren’t completely open an increase in feed-in-tariffs or price guarantees increases the research of both domestic and international firms; however domestic firms research increases more.
Theoretical Results Continued • Result 3: An increase in research subsidy φi will increase the equilibrium level of research of the domestic firm and decrease the international firm’s research.
Empirical • The basic specification will be as follows, where t is time from 1987 to 2007 and i is country:
Patents • The European Patent Office maintains a searchable patent database. • European, worldwide and US patents • 1978 to present • Searchable based on: • keyword(s) in title or abstract • application number • publication number • priority number • inventor • applicant • European classification (ECLA) • International Patent Classification (IPC) • Relevant patents can be determined using International Patent Classification (IPC) codes (World International Patent Organization, 2008)
Patents Continued IPC codes for Wind
Explanatory Variables • Policy variables will be determined using the International Energy Agency Global Renewable Energy Policies and Measures Database (OECD/IEA, 2008b). • The database allows the searching of policies based on type of policy, country and policy target. • Available from 1974 up to July 2008. • Oil price can be found using IEA database.