Download
1 / 10
100 likes | 239 Views
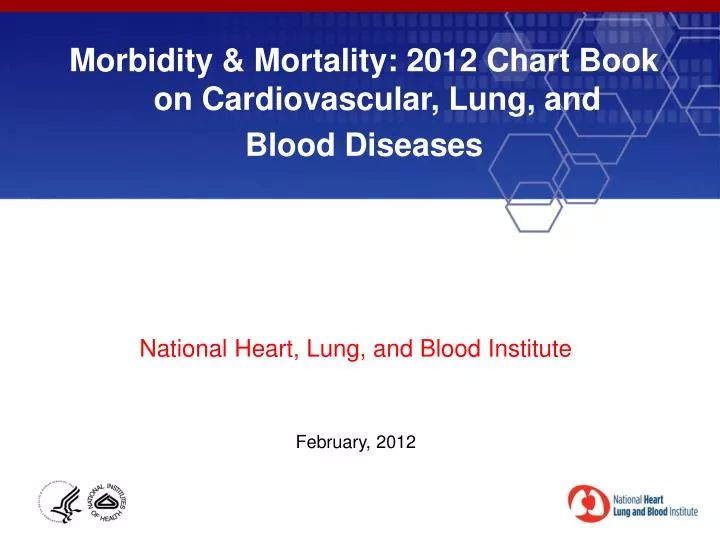
Morbidity & Mortality: 2012 Chart Book on Cardiovascular, Lung, and Blood Diseases. National Heart, Lung, and Blood Institute February, 2012. Chapter 5 – Blood Diseases. The term blood diseases is used here to mean:

E N D
Morbidity & Mortality: 2012 Chart Book on Cardiovascular, Lung, and Blood Diseases National Heart, Lung, and Blood Institute February, 2012
Chapter 5 – Blood Diseases • The term blood diseases is used here to mean: • Diseases within the diagnostic categories listed in Diseases of Blood and Blood-Forming Organs and Certain Disorders Involving the Immune Mechanism of ICD-10 • Hemochromatosis * Blood clotting diseases, most of which are subsumed under CVD, have been excluded . As have other blood diseases, such as bleeding and red blood disorders of the newborn and serum hepatitis.
Chart 5–1 Deaths From Blood Diseases,Percent By Subgroup, U.S., 2008 Aplastic Anemia 9.5% Sickle Cell Anemia 5.0% Other Diseases of Blood & Blood-Forming Organs 17.5% Other Anemias 35.3% Hemochromatosis 1.9% Diseases of White Blood Cells 4.5% Coagulation Defects 17.9% Purpura & Other Hemorrhagic Conditions 8.3% Total Deaths = 10,066 (100%) * Compiled from Vital Statistics of the United States, NCHS.
Chart 5-3 Hospitalizations for Aplastic Anemia by Primary & Secondary Diagnosis, U.S. Hospitalizations (Thousands) Year Years 1988–2009.
Chart 5–4 Death Rates* for Aplastic Anemia By Race & Sex, U.S., 2004–2007 Deaths/100,000 Population * Average annual age-adjusted rates.
Chart 5-5 Death Rates* for Aplastic Anemia by Age, Race, & Sex, U.S., 2004–2007 Deaths/100,000 Population Age (Years) * Average annual rates. Rates are unreliable for black males aged 35–54 years and black females aged 35–64 years.
Chart 5–6 Hospitalization Rates for Sickle Cell Anemia in Blacks by Age, U.S., 1988–2009 Hospitalizations/10,000 Population Year
Chart 5–7 Death Rates* for Sickle Cell Anemia in Blacks by Sex, U.S., 1980–1984 to 2003–2007 Deaths/100,000 Population Years * Age-adjusted average annual rates.
Chart 5–8 Death Rates* for Sickle Cell Anemia in Blacks by Age and Sex, U.S., 2004–2007 Deaths/100,000 Population Age (Years) * Average annual rates. Rates are unreliable for black males aged 5–14 and 65–74 years and black females aged 5–14 and 75–84 years.