Download

1 / 75
770 likes | 955 Views
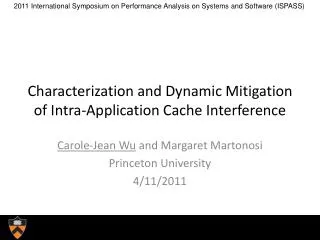
Characterization and Optimization of Cache Behavior. Kristof Beyls, Yijun Yu, Erik D’Hollander http://winpar.elis.rug.ac.be/ppt Electronics and Information Systems Gent University, Belgium. Presentation overview. Part 1: Reuse distance as a metric for cache behavior

E N D
Characterization and Optimization of Cache Behavior Kristof Beyls, Yijun Yu, Erik D’Hollander http://winpar.elis.rug.ac.be/ppt Electronics and Information Systems Gent University, Belgium
Presentation overview • Part 1: Reuse distance as a metric for cache behavior • How accurate is reuse distance in predicting cache behavior? • How effective are compilers in removing cache misses? • Part 2: Program-centric visualization of data locality • Reuse distance-based visualization • Pattern-based visualization • Part 3: Cache remapping: eliminating cache conflicts in tiled codes
Overview reuse distance • Introduction • Reuse distance ↔ cache behavior • Effect of compiler optimization • Capacity miss reduction techniques • Summary
Overview reuse distance • Introduction • Reuse distance ↔ cache behavior • Effect of compiler optimization • Capacity miss reduction techniques • Summary
1. Introduction • Gap between processor and memory speed widens exponentially fast • Typical: 1 memory access = 100 processor cycles • Caches can deliver data more quickly, but have limited capacity • Reuse distance is a metric for a programs cache performance
Overview reuse distance • Introduction • Reuse distance ↔ cache behavior • Effect of compiler optimization • Capacity miss reduction techniques • Summary
2.a Reuse distance • Definition: The reuse distance of a memory access is the number of unique addresses referenced since the last access to the requested data.
2.b Reuse distance and fully associative cache Property: In a fully associative LRU cache with n cache lines, a reference will hit if the reuse distance d<n. Corollary: In any cache with n lines, a cache miss with reuse distance d is:
Conflict Capacity Cache size 2.d Classifying cache misses for SPEC95fp
Overview reuse distance • Introduction • Reuse distance ↔ cache behavior • Effect of compiler optimization • Capacity miss reduction techniques • Summary
Conflict Capacity 3.a Reuse distance after optimization
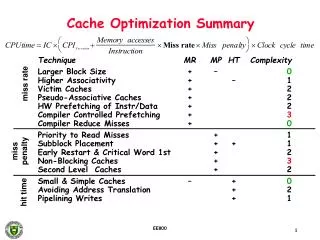
3.b Effect of compiler optimization • SGIpro compiler for Itanium • 30% of conflict misses are removed,1% of capacity misses are removed. • Conclusion: much work needs to be done to remove the most important kind of cache misses: capacity misses.
Overview reuse distance • Introduction • Reuse distance ↔ cache behavior • Effect of compiler optimization • Capacity miss reduction techniques • Summary
CS CS CS CS CS CS CS 4. Capacity miss reduction • Hardware level • Increasing cache size Reuse distance must be smaller than cache size • Compiler level • Loop tiling • Loop fusion • Algorithmic level
4.a Algorithmic level • Programmer has a better understanding of the global program structure. • Programmer can change algorithm, so that long distance reuses decrease. • Visualization of the long reuse distances can help the programmer to identify poor data locality in the code.
Overview reuse distance • Introduction • Reuse distance ↔ cache behavior • Effect of compiler optimization • Capacity miss reduction techniques • Summary
5. What did we learn? • Reuse distance predicts cache behavior accurately, even for direct mapped caches. • Compiler optimizations for eliminating capacity misses are currently not powerful enough. A large overview over the code is needed. • Programmer has large overview of code. Reuse distance visualization can help the programmer to identify regions with poor locality.
Part 2: Program-Centric Visualization of Data Locality (IV2001)
Background • A program uses thecache transparently. The data locality is obscure to the programmer without • by cache lines: What happens in the cache? e.g. CVT, Rivet • by references: What happens to the program? - Reuse distance-based visualization - Pattern-based visualization
Reuse distance-based Visualization What is the source of the capacity misses in my code?
Instrumentation • Programs are instrumented to obtain the following data: • Reuse distance distribution for every static array reference • It indicates the cache behavior of the reference • For every static reference, the previous accesses to the same data is stored. • It can show the programmer where the previous accesses occurred for long distance reuses.
H(i,j) (1,0,-15) (0,0,1) HIT MISS (1,0,-15) H(i,j) (0,0,1) Main view on SWIM 218 cache lines = 218 * 64 bytes = 16 Mbyte cache is needed to capture reuse 18 4
How to optimize locality in SWIM • Reuse between iterationsof the outer loop (1,0,-15): • tiling is needed • but: non-perfectly nested loop • so: tiling needs to be extend • e.g. Song&Li, PLDI99: extending tiling for this kind of program structure: 52% speedup, because of increased temporal reuse DO ncycle=1,itmax do 10 i do 10 j 10 s1(i,j) s2 do 20 i do 20 j 20 s3(i,j) ... ENDDO
Reuse-distance based visualization enables: • The tool shows the place and the reason for poor data locality in the program. • Visualization of reuse distances in the code enables recognizing code patterns leading to capacity misses. • Compiler writer can use the tool to think about new effective program optimizations for data locality.
Pattern-based Visualization Show me the cache behavior of my program!
Distribution of arrays and linenos Views of the cache behavior • Cache misses • Cache hits and misses • Compulsory, capacity and conflict misses • Horizontally wrap-around of millions of pixels will make periodical patterns visible • Histograms • Reuse distances • Cache misses
Experiments • Matrix multiplication • Tiled matrix multiplication • TOMCATV (SPECfp95) • FFT
Matrix multiplication #define N 40 for (i=0;i<N;i++) for (j=0;j<N;j++) { c[i][j] = 0; for (k=0;k<N;k++) c[i][j] += a[i][k] * b[k][j]; }
Cold miss Capacity miss MM Histogram of reuse distance
Tiled matrix multiplication B*B+B+1<1024/8 1<B<12 #define N 40#define B 5 double a[N][N],b[N][N],c[N][N]; for (i_0=0;i_0<N; i_0+=B) for (j_0=0;j_0<N; j_0+=B) { for (i=i_0; i<min(i_0+B,N); i++) for (j=j_0; j<min(j_0+B,N); j++) c[i][j]=0.0; for (k_0=0;k_0<N; k_0+=B) for (i=i_0; i<min(i_0+B,N); i++) for (j=j_0; j<min(j_0+B,N); j++) for (k=k_0; k<min(k_0+B,N); k++) c[i][j] += a[i][k] * b[k][j]; }
Cold miss Capacitymiss TMM: Fewer long reuse distances
TOMCATV histogram
Cold miss Capacity miss TOMCATV: Histogram with arrays
TOMCATV: Conflict misses with arrays Hits Top 20
524 TOMCATV: Back to the source code for (j = 2; j < n; ++j) { for (i = 2; i < n; ++i) { …217 pyy = x[i + (j + 1) * 513 - 514] - x[i + j * 513 - 514] * 2. + x[i + (j - 1) * 513 - 514];219 qyy = y[i + (j + 1) * 513 - 514] - y[i + j * 513 - 514] * 2. + y[i + (j - 1) * 513 - 514];221 pxy = x[i + 1 + (j + 1) * 513 - 514] - x[i + 1 + (j- 1) * 513 - 514] - x[i - 1 + (j + 1) * 513 - 514] + x[ i - 1 + (j - 1) * 513 - 514];224 qxy = y[i + 1 + (j + 1) * 513 - 514] - y[i + 1 + (j- 1) * 513 - 514] - y[i - 1 + (j + 1) * 513 - 514] + y[ i - 1 + (j - 1) * 513 - 514]; …} (i + (j + 1) * 513 – 514)*8/32 = (i + j * 513 – 514)*8/32 mod (1024/32)
TOMCATV: After array alignment Changing array size from 513 to 524 leads to about 50% speedup of TOMCATV on real input set on Pentium III.
Pattern-based visualization: • Pattern-based visualization of the cache behavior on program execution guides the programmer to detect the bottleneck for cache optimization • Cache optimizing program transformations, such as loop tiling, array padding and data alignment, can be verified with the visualization
Cache Remapping to Improve the Performance of Tiled Algorithms (Euro-Par 2000, J.UCS Oct. 2000)
Overview Cache Remapping • Tiling • Cache remapping • Concept • Code transformation for EPIC • Evaluation • Summary
Overview Cache Remapping • Tiling • Cache remapping • Concept • Code transformation for EPIC • Evaluation • Summary
If cache size < N*N, no temporal reuse for ii:=1 to N by B1 do for kk:=1 to N by B2 do for jj:=1 to N by B3 do for i:=ii to min(ii+B1-1,N) do for k:=kk to min(kk+B2-1,N) do for j:=jj to min(jj+B3-1,N) do C[i,j]=A[i,k]*B[k,j]; Ti Td Possible Cache reuse if cache size >= B2*B3 Loop Tiling Matrix Multiplication for i:=1 to N do fork:=1 to N do forj:=1 to N do C[i,j]+=A[i,k]*B[k,j];
Tiling Reduces Capacity Misses • Tiling reduces capacity misses by shortening the reuse distances