Download

1 / 55
550 likes | 677 Views
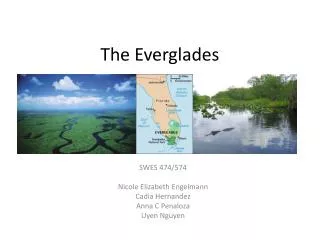
Okeechobee and the Everglades. Lake Okeechobee. Kissimmee River. 730 square miles. third-largest lake completely within the United States. average depth of 3 m (9 ft). about 6000 years old. Kissimmee/Lake Okeechobee/Everglades. “Liquid Heart of S. Florida”. Water Source for

E N D
Lake Okeechobee Kissimmee River 730 square miles third-largest lake completely within the United States average depth of 3 m (9 ft). about 6000 years old
Kissimmee/Lake Okeechobee/Everglades “Liquid Heart of S. Florida” Water Source for Everglades Florida Bay Lower E. coast
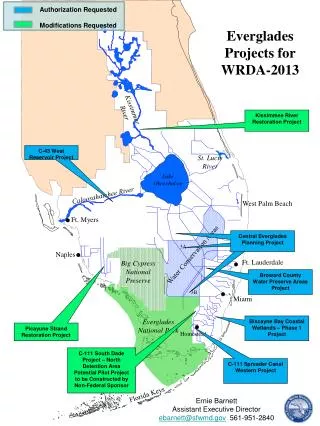
Okeechobee and the Everglades Historic Flow Patterns Historic flow patterns in the Kissimmee – Okeechobee – Everglades system has been significantly altered, beginning in the late 1800’s. The design was to drain significant areas for agriculture and development and to prevent floodwaters from communities to the south and east. Several canal projects as well as the Hoover Dike inhibits natural flow of water southward from Okeechobee.
Began in 1881 By 1920
History First Survey 1835 Swamplands Act 1850 First Canals 1881 Everglades Drainage District 1905 Melaleuca Tree Introduction 1906 Tamiami Trail 1928 Bell Glade Hurricane 1928 Hoover Dike 1932 Eastern Perimeter Levee 1954 Water Conservation Areas 1963
Former extent of Kissimmee Basin and floodplain Hoover Dike (1932) Everglades Agricultural Area (EAA) Perimeter Levee (1954) Water Conservation Areas (management of flow) To Atlantic To Gulf
Current Historic EAA
EAA drainage basin 12,000 km2 700,000 ac Sugar, Rice, Veg.
Organic soils possessing high natural fertility Historically flooded
Water restricts the movement of oxygen The diffusion of oxygen through water is about 1000 times slower than diffusion through air Flooded Marsh Under flooded conditions, oxygen levels tend to be low Organisms?
Aquatic Plants Die Heterotrophic microorganisms decompose tissues Aerobic heterotrophic organisms use oxygen Oxygen becomes depleted in water; it cannot diffuse fast enough to support aerobic heterotrophs Anaerobic heterotrophs become dominant
Anaerobic Heterotrophic Organisms Can use energy stored in complex carbon compounds in the absence of free oxygen The energy is obtained by exchanging electrons with elements other than oxygen. Nitrogen (nitrate) Sulfur (sulfate) Iron (Fe3+)
Anaerobic respiration is less efficient and produces less energy. C6H12O6 + 6O2 → 6CO2 + 6H2O 2880 kJ C6H12O6 + 3NO3- + 3H2O = 6HCO3- + 3NH4+ 1796 kJ C6H12O6 + 3SO42-+ 3H+ = 6HCO3- + 3HS- 453 kJ Therefore, anaerobic decomposition is much slower than aerobic decomposition.
Flooded Soils additions Losses (CO2) anaerobic decomposition of organic matter is much slower than aerobic decomposition. Organic matter Organic matter is added to the soil faster than it can be decomposed by microorganisms limestone Accumulation of organic matter at the soil surface
Buildup of Organic soils Organic matter decomposes slowly when submerged in water. (anaerobic decomposition) Soils throughout the glades historically have been submerged. (anaerobic conditions) Led to vast amounts of organic matter accumulation, sometimes >10 ft. thick. Organic matter continues to accumulate as long as flooded conditions persist.
Drainage EAA Drainage exposes soils to oxygen and decomposition by aerobic heterotrophic organisms which can more efficiently decompose organic matter
Drainage Losses (CO2) additions Conversion from anaerobic to Aerobic decomposition (much more efficient) C6H12O6 + 6O2 → 6CO2 + 6H2O Losses of organic matter by decomposition exceed new additions – soils disappear
Subsidence of Organic soils up to 10 feet
Public Funding Issues Revisited in State’s Buyout of U.S. Sugar South Florida Business Journal - by Paul Brinkmann a bill in the Florida Senate that would require voter approval of any certificates of appreciation (bonds) issued by water districts.
Restoration of More Natural Flow Regimes Comprehensive Everglades Restoration Plan restoration, preservation, and protection of the South Florida ecosystem recover and sustain those essential hydrological and biological characteristics that defined the original pre-drainage Everglades interconnected and interrelated wetlands provide for water supply and flood protection reestablishment of native plant communities Low levels of nutrients
Phosphorus Limiting Element to Primary Productivity Chlorophyll ATP Phospholipids Additions increase Productivity ATP
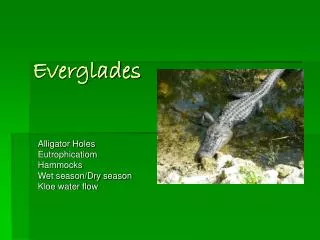
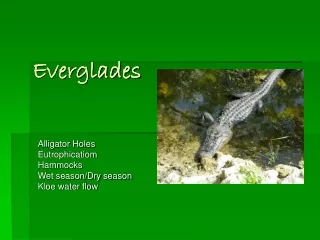
Saw grass to Cattails Eutrophication Alteration of natural communities through excess P
Unimpacted P-impacted
Phosphorus loading to S. Florida Ecosystem Dairy/Beef Inputs North and South of Okeechobee Agriculture Kissimmee Basin
Kissimmee drainage basin 12,000 km2 Dairy and Beef In 1521 Ponce de Leon brought horses and cattle to Florida, making it the oldest cattle raising state in the country. (1947) No other part of our country had cattle until the Pilgrims brought cattle in the early 1600's Florida's ranchers now raise the third largest number of cattle of any state east of the Mississippi
Phosphorus Solid Manure: 5.5 g / kg total Phosphorus One cow can excrete between 40 and 60 g of phosphorus per day Subject to movement via runoff, stream flow, soil water movement, and groundwater movement
Cattle and Dairy Okeechobee, Highlands, and Glades Counties: 328,000 head (19% of total) Okeechobee County is ranked number one for all cattle in the state
Kissimmee – Okeechobee - Everglades The Lower Kissimmee River Basin is among largest sources of external phosphorus loading to Lake Okeechobee The Kissimmee river alone contributes about 20% of the phosphorus flowing into Lake Okeechobee Okeechobee, in turn, is a source of phosphorus to the Everglades
Surface Water Improvement Management Act: SWIM (1987) Mandates phosphorus load level of 397 tons/yr Clean Water act: 154.3 tons per year deadline of January 1, 2015 SWIM Plan priority basins Lake Target level of 40 ppb in Lake Okeechobee
Some Strategies The Dairy Rule (1987) creating lagoons to capture and contain dairy waste Implement Best Management Practices (BMPs) buffer areas around places animals congregate, eliminating phosphorus fertilization near tributaries, reducing phosphorus imports in animal feeds, reducing animal density Works of the District Rule permits are required for all discharges into waterways Dairy Buy-Out Program to facilitate removal of animals from dairies not able to comply 19 of 45 Dairies Remain
Phosphorus Loads to Okeechobee Above Target Above SWIM target (tons) SWIM target: 397 tons 2007: 146 ton reduction of P entering Okeechobee
Phosphorus concentrations in the Lake remain at about 117 ppb The target level is 40 ppb.
Internal Loading Release of phosphorus from bottom sediments Decomposition of submerged aquatic vegetation releasing phosphorus back into the water column Dissolution of compounds in sediments which bind and store phosphorus.
Internal Loading Phosphorus and Iron Phosphorus has a strong affinity for iron FePO4 Solid Precipitate Readily incorporates into bottom sediments
Internal Loading Fe3+ high oxygen Fe2+ low oxygen Dissolved phosphorus combines with oxidized iron (Fe3+) to create an insoluble compound that becomes buried in lake sediments. Fe3+ + PO43- = Fe(PO4) Simplified: solid If oxygen contents are reduced (anoxic bottom sediments) the Fe3+ converts to Fe2+ which solubilizes the compound returning P to water. 2+ 3- Fe (PO4) to water P released by sediments is taken up by photosynthetic algae faster than it can be returned to the sediments
Lake Okeechobee Action Plan Developed by the Lake Okeechobee Issue Team December 6, 1999 RECOMMENDATION – Control Internal Phosphorus Loading. Phosphorus-rich mud sediments need to be removed from the lake to the maximum extent that is practical, in order to reduce internal phosphorus loading. Unless this internal loading is substantially reduced, it may take as long as 100 years for the lake to respond to watershed phosphorus control programs.
Crops: Everglades Agricultural Area EAA Sugar, Rice, Veg. 700,000 ac
EAA • 1940’sthousands of acres converted to agricultural production • 1959Cuban exiles established sugar plantations • 1960sSugar production increased 4-fold Sugar 382,000 acres 46% U.S. Palm Beach, Glades, Hendry Today, sugarcane production contributes two-thirds of the economic production of Everglades agriculture, and uses nearly 80% of the crop land in the EAA Sugar and vegetable production contributes phosphorus to the ecosystem primarily through fertilizers and to a lesser extent through decomposition of plants.
drainage basin 12,000 km2 Dairy and Beef In 1521 Ponce de Leon brought horses and cattle to Florida, making it the oldest cattle raising state in the country. (1947) No other part of our country had cattle until the Pilgrims brought cattle in the early 1600's Florida's ranchers now raise the third largest number of cattle of any state east of the Mississippi
Cattle and Dairy Okeechobee, Highlands, and Glades Counties: 328,000 head (19% of total) Okeechobee County is ranked number one for all cattle in the state
Phosphorus Solid Manure: 5.5 g / kg total Phosphorus
Kissimmee – Okeechobee - Everglades The Lower Kissimmee River Basin is among largest sources of external phosphorus loading to Lake Okeechobee The Kissimmee river alone contributes about 20% of the phosphorus flowing into Lake Okeechobee
Surface Water Improvement Management Act: SWIM (1987) Mandates phosphorus load level of 397 tons/yr Clean Water act: 154.3 tons per year deadline of January 1, 2015 SWIM Plan priority basins Lake Target level of 40 ppb in Lake Okeechobee
Some Strategies The Dairy Rule (1987) creating lagoons to capture and contain dairy waste Implement BMPs buffer areas around places animals congregate, eliminating phosphorus fertilization near tributaries, reducing phosphorus imports in animal feeds, reducing animal density Works of the District Rule permits are required for all discharges into waterways Dairy Buy-Out Program to facilitate removal of animals from dairies not able to comply 19 of 45 Dairies Remain
Effectiveness of P controls Above Target SWIM target: 397 tons Phosphorus concentrations in the Lake remain at about 117 ppb The target level is 40 ppb.