Download
1 / 19
190 likes | 322 Views
Canada Lite: impact of LibQUAL + ® Lite on the members of the LibQUAL + Canada Consortium. A study by Sam Kalb (Queen’s University), Eun -ha Hong ( Wilfrid Laurier University), Susan Czarnocki (McGill University), Sylvain Champagne (HEC Montréal)

E N D
Canada Lite: impact of LibQUAL+® Lite on the members of the LibQUAL+ Canada Consortium A study by Sam Kalb (Queen’s University), Eun-ha Hong (Wilfrid Laurier University), Susan Czarnocki (McGill University), Sylvain Champagne (HEC Montréal) Presenters: Sam Kalb (Queen’s University), Eun-ha Hong (Wilfrid Laurier University)
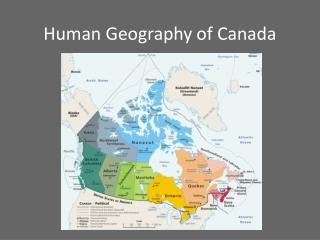
LibQUAL+ Canada Consortium • Largest LibQUAL+® consortium • Bilingual (English and French) • 2010: 47 members (43 universities, 4 community colleges) • 2007: 53 members (42 universities, 5 community colleges, 6 federal government libraries)
Suggested Recommendations fromLibQUAL+ Canada 2007 • Alternative, briefer survey format • Standardised user categories • Integration of multilingual survey questions, incl. optional questions
LibQUAL+® 2010 Consolidated Data Structure • Single institution ID vs separate ID for each survey language • Single user group ID for each corresponding group vs separate IDs for each language variant • Survey questions in each language are linked, e.g. consortial package of optional questions in English and French can be selected in one step
LibQUAL+® 2010 Lite SurveyFormat
LibQUAL+ Canada 2010Survey Formats ¾ of members selected Lite format
LibQUAL+ Canada Study Opportunity: • Examine Lite survey format as a potential impact factor on the results of the LibQUAL+ survey: • English/French respondents, completed surveys, valid surveys, means scores • 35 member university libraries participated in the 2010 & 2007 surveys • Large readily available consortial data sets for 2010 (85,229) & 2007 (92,124)
Granularity & Lite Format • Potentially, too few respondents for reliable comparative analysis of 2010 and past results in: • non-mandatory core & optional survey questions • Library as Place by Most used library • cases where total Lite survey response rates are relatively low
Design/Methodology/Approach Statistical Analysis Overview • Completion rate calculation (includes both valid and invalid surveys.) • Valid survey rate calculation (includes only surveys which met the criteria set by ARL to be valid.) • Mean comparison: Averages
Design/Methodology/Approach Total Raw Consortia data sets Incomplete Surveys Excluded in all analysis Completed surveys :leads to “Completion Rate” Valid Surveys :Leads to Valid Survey rates Invalid Surveys :Excluded from Completed Surveys Mean Comparison Only answers from Univeristy or College who did survey in both years & from faculty, grad/undergrad students.
Factors • Completion rate, the valid survey rate, and the variation by language as a potential indicator of the difference between LibQUAL+® in 2007 and 2010 • Z tests for completion rate • Z tests for valid survey rate • T-tests for the comparison of the mean scores in three dimensions and further divided by user groups.
Factors cont’… • Analysis Process examined in three stages using Completion rate and Valid survey rate 2007 full vs. 2010 full-> Z test : There is a difference 2010 full vs. 2010 Lite-> Z test : There is a difference 2010 Lite vs.2007 full -> Z test : There is a difference Conclusion: There is a DIFFERENCE between using Lite and Full format.
Factors cont’… • Now we can look at the direction with certainty : Completion Rate and Valid Survey Rate
Factors cont’… • Now we can look at the difference with certainty : Language Variations
Mean Values – 2010 Lite vs 2007 Full Format • All comparisons show significance with less than .01 p value. • Average scores for all dimensions have gone up • This result is consistent among different group types: undergraduates, graduates, faculty Caution: Very large dataset with multiple T tests but given the limitation of our datasets, this is the best conclusion we can draw with some level of confidence.
Challenge in comparing 2007 & 2010 data sets • Change in the variable names • Variations of dummy variable treatments • Establishing the comparison of two datasets based on different formats(Full vs Lite) • Changes in the participating institutions • Extremely large set to implicate potential errors in the analysis • 3 year gap: possibility of many unknown factors affecting the result.
Completion Rates • 2010 LibQUAL+® Lite: 61.7% • 2010 LibQUAL+® full: 54.3% • 2007 LibQUAL+® full: 48.8% Completed Survey. The user has supplied a rating for all items on the survey.
LibQUAL+ Canada Study Thank you! Any Question?