Download
1 / 60
620 likes | 730 Views
Computer as a Technologist Tool. AC Signals and Oscilloscopes. Alternating Current: The Basics. A waveform is a graph relationship between magnitude and time. So far we have been dealing only with direct current (DC) waveforms. Current moving in one direction all the time.

E N D
Computer as a Technologist Tool. AC Signalsand Oscilloscopes
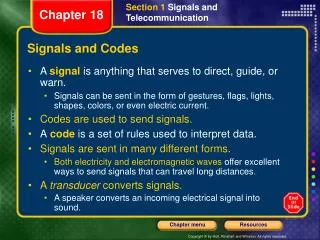
Alternating Current: The Basics • A waveform is a graph relationship between magnitude and time. • So far we have been dealing only with direct current (DC) waveforms. • Current moving in one direction all the time. • Alternating Current is any current that periodically changes direction • Term typically used to describe sinusoidal waveforms.
Alternating Current: The Basics • Basic AC Operation
Alternations – the positive and negative transitions • Cycle – the complete transition through one positive alternation and one negative alternation • Half-Cycle – one alternation Alternations and Cycles
Period (Cycle Time) • Period – the time required to complete one cycle of a signal
Frequency • Frequency – the rate at which the cycles repeat themselves • Unit of Measure – hertz (Hz) = 1 cycle/second
Period and Frequency • Frequency and period are inversely related where T = the period of the waveform in seconds = the frequency in Hz
Multi-meters are typically used to measure DC voltages and currents. • Multi-meters can also measure AC voltages and currents but are not very accurate • Often the AC signals are assumed to have a 60Hz frequency. • A better approach that provides a detailed analysis of an AC signal is to use an Oscilloscope. Measuring AC Signals
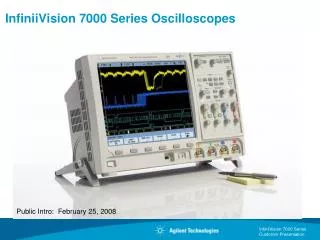
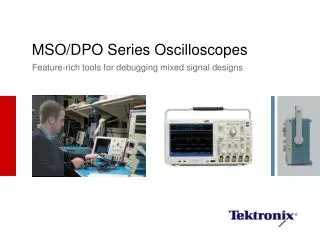
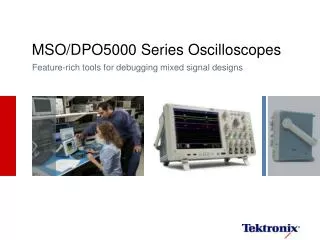
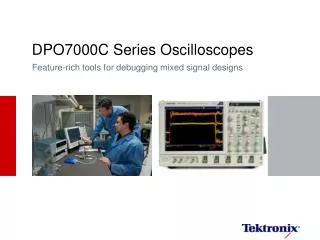
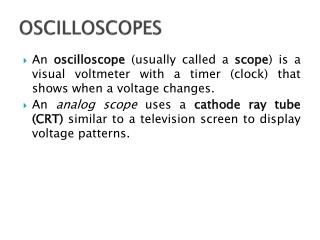
The oscilloscope is basically a device that draws a graph of an electrical signal. • Two types exist: • Analogue Oscilloscopes • These are used less and less nowadays but are still around • Digital Storage Oscilloscopes (DSO) • More common e.g. Tektronix 2214 Oscilloscopes
Bandwidth • The frequency range of the instrument. • Sample Rate / 10 • Record Length • The number of waveform points used to create a record of a signal. • Sample Rate • How frequently a digital oscilloscope takes a sample of the signal, specified in samples per second (S/s). • If the sample rate of a scope is 250 Mega-Samples/per second what is the scope’s bandwidth? Key DSO Specifications Bandwidth = (250 MS/s ) / 10 = 25 MHz
In most applications, the graph shows how signals change over time: • the vertical (Y) axis represents voltage and the horizontal (X) axis represents time. Oscilloscopes
Time Base Control – determines the amount of time represented by the major divisions along the x-axis Oscilloscope Time and Frequency Measurements
Position and Volts-per-division (volts/div) • The vertical position control allows you to move the waveform up and down on the display. • The volts-per-division (volts/div) setting varies the size of the waveform on the screen. The volts/div setting is a scale factor. E.G If the volts/div setting is 5 volts, then each vertical division represents 5 volts and the entire screen of 8 divisions can display 40 volts from top to bottom • Input Coupling • Setting determines which part of the signal presented to input is displayed on the screen: • DC coupling shows all of an input signal. • AC coupling blocks the DC component of a signal so that you see the waveform centered around zero volts. • Ground coupling disconnects the input signal from the vertical system, which lets you see where zero volts is located on the screen. DSO Front Panel - Vertical System and Controls
Position and Seconds-per-division (sec/div) • The horizontal position control allows you to move the waveform left and right on the display. • The seconds-per-division (sec/div) setting varies the rate at which the waveform is drawn across the screen (also known as the time base setting or sweep speed). • The sec/div setting is a scale factor. If the setting is 1 ms, then each horizontal division represents 1 ms and the entire screen of 10 divisions represents 10 ms. DSO Front Panel - Horizontal System and Controls
An oscilloscope’s trigger function synchronizes the horizontal sweep at the correct point of the signal, essential for clear signal characterization. Trigger controls allow you to stabilize repetitive waveforms and capture single-shot waveforms. DSO Front Panel -Trigger System and Controls
Can use BNC to alligator clip cables to connect oscilloscope to circuit / signal source. Oscilloscope probes however exhibit higher noise immunity, especially at high frequencies. Probes have two settings X1 and X10. X10 setting provides better noise immunity but “attenuates” the signal 10 times. If using a X10 probe make sure oscilloscope X10 setting is used. Oscilloscope probes
Device capable of producing many types of waveforms with varying frequencies and amplitudes. Signal Generator
What is a waveform? What is the relationship between alternations and cycles? What is the period of a waveform? What is the frequency of a waveform? And what are the units of frequency? What is an oscilloscope? What do the trigger controls enable you to do? Assume you are viewing 4 cycles of a waveform on an oscilloscope. Then, you double the frequency of the waveform being displayed. What adjustment (if any) needs to be made to the time/Div control to display 4 cycles of the higher frequency waveform on the screen? Review
Understanding Voltage Measurements • Peak and Peak-to-Peak Values • Peak Value – the maximum value reached by either alternation of the waveform • Peak-to-Peak Value – the difference between its positive and negative peak values
Understanding Voltage Measurements • Instantaneous Value – the magnitude of a voltage or current waveform at a specified point in time • Lowercase t = instantaneous time • Lowercase v = instantaneous voltage • Lowercase i = instantaneous current • v(t) = Vpk*sin(wt)
Understanding Voltage Measurements • Full-Cycle Average – the average of all the instantaneous values of voltage (or current) throughout one complete cycle (always 0 for pure ac) • What if the AC signal is riding on a DC offset ?
Understanding Voltage Measurements • Half-Cycle Average – the average of all a waveform’s instantaneous values of voltage (or current) through either of its alternations Where Vpk= the peak value of the waveform
A sine wave has a peak values of +/- 15V. Calculate the half cycle average voltage(Vave). Example
Average Power and RMS Values • The average value of power generated during each cycle of the waveform is calculated using rms values • Root-Mean-Square (rms) – value that, when used in the appropriate power equation, gives you the average power of the waveform • Take the square of a single period of a waveform, then take its mean, then square root the result. • The rms values of a waveform are also called effective values • Multimeters always read rms values for ac voltage and current
A circuit consists of a sinusoidal voltage source whose Vpk = 15 V and a series load resistor RL= 100Ω Find the rms voltage and current Example
A circuit consists of a sinusoidal voltage source whose Vpk = 12 V and a series load resistor RL= 330Ω Calculate the average load power Example
Sine Wave Generation • Magnetic Induction of Current – current through a coil can be used to generate a magnetic field
Sine Wave Generation • Or current can be created by moving a wire through a magnetic field
Generating a Sine Wave • a sine wave can be generated by rotating a “loop conductor” through a stationary magnetic field
Phase • the phase of a given point is its position relative to the start of the waveform, expressed in degrees
Phase • Phase and time measurements are related as shown by the equation, where = the phase of the point (vx) t = the time from the start of the cycle to vx T = the time required for one complete cycle
Phase • When the period of a waveform is known, the time from the start of a waveform to a given phase angle can be found as: • Given the time instant t, the instantaneous phase angle can also be determined as :
Phase and Time Measurements • Phase and Time Measurements
Phase Angles • Phase Angles Red is lagging the blue by 90o . Blue is leading the red by 90o .
Find the phase shift between these two waveforms. Which one is leading and which one is lagging? Example
Instantaneous Values • Instantaneous Values • What is v if Vpeak = 10V ?
Radians • Phase Measurements: The Radian Method • Radian – the angle formed at the center of a circle by two small radii separated by an arc of equal length
The Radian Method • Phase Measurements: The Radian Method (Continued) • 2 (rad) = 360º • 1 rad = 360º/2 57.296º • Angular Frequency (Velocity)– the rate at which the phase and instantaneous values of a sine wave change where = angular velocity, in radians per second 2 = the number of radians in one cycle f= the number of cycles per second (frequency)
The Radian Method • Instantaneous Values • If phase angle is known: • If frequency is known: where = 2f (the angular velocity, in radians per second) t = the designated time interval from the start of the cycle
Static and Dynamic Values • Static Values – do not change during the normal operation of a circuit. A resistor’s resistance is a static value. • Dynamic Values – do change during the normal operation of a circuit. The instantaneous value of a sine wave is a dynamic value.
Static and Dynamic Values (Continued) • Dynamic Values • vx = 4 V 150ºwhere: 4 V is the magnitude and 150º is the phase angle • Always has one or more specified conditions • Both magnitude and phase are necessary to define the value
DC Offset • - A sine wave with a dc offset has: • Unequal positive and negative peak values • An average value that is equal to the dc offset (rather than 0) Insert Figure 9.36
Electromagnetic Wave • a waveform that consists of perpendicular electric and magnetic fields • Eg. Light, Radio-waves, UV rays, infrared, x-rays, gamma rays.
Wavelength • – the physical length of one cycle in space as opposed to in time