Download
1 / 15
150 likes | 272 Views
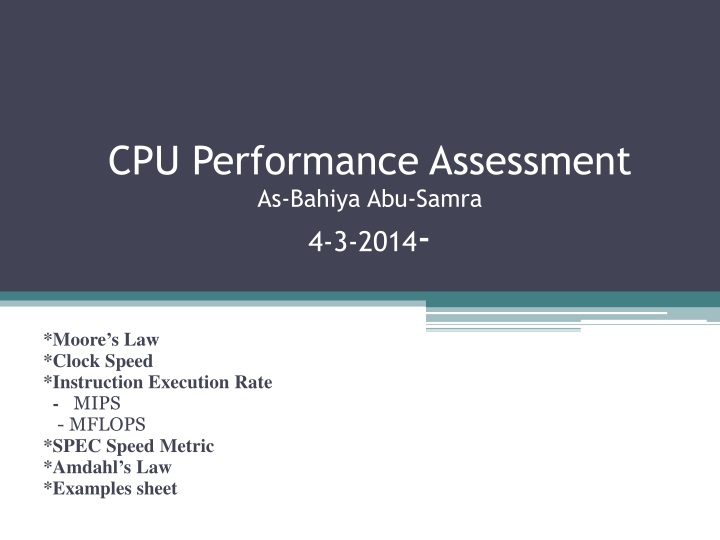
CPU Performance Assessment As- Bahiya Abu- Samra 4-3-2014 -. *Moore’s Law *Clock Sp eed *Instruction Execution Rate - MIPS - MFLOPS *SPEC Speed Metric * Amdahl’s Law *Examples sheet. Moore’s Law. Increased density of components on chip.

E N D
CPU Performance AssessmentAs-BahiyaAbu-Samra4-3-2014- *Moore’s Law *Clock Speed *Instruction Execution Rate - MIPS - MFLOPS *SPEC Speed Metric *Amdahl’s Law *Examples sheet
Moore’s Law • Increased density of components on chip. • Gordon Moore – cofounder of Intel. • Number of transistors on a chip will double every year. • Since 1970’s development has slowed a little. • Number of transistors doubles every 18 months. • Cost of a chip has remained almost unchanged. • Higher packing density means shorter electrical paths, giving higher performance. • Smaller size gives increased flexibility. • Reduced power and cooling requirements. • Fewer interconnections increases reliability.
Growth in CPU Transistor Count This figure reflects the famous Moore’s law.
Performance AssessmentClock Speed • Key parameters • Performance, cost, size, security, reliability, power consumption • System clock speed • In Hz or multiples of • Clock rate, clock cycle, clock tick, cycle time • Signals in CPU take time to settle down to 1 or 0 • Signals may change at different speeds • Operations need to be synchronised • Instruction execution in discrete steps • Fetch, decode, load and store, arithmetic or logical • Usually require multiple clock cycles per instruction • Pipelining gives simultaneous execution of instructions • So, clock speed is not the whole story
Instruction Execution Rate • Millions of instructions per second (MIPS) • Millions of floating point instructions per second (MFLOPS) • Heavily dependent on instruction set, compiler design, processor implementation, cache & memory hierarchy
INSTRUCTION EXECUTION RATE A processor is driven by a clock with a constant frequency f or, equivalently, a constant cycle time T, where T= 1/f Define the instruction count, Ic, for a program as the number of machine instructions executed for that program until it runs to completion or for some defined time . interval Let CPI i be the number of cycles required for instruction type i. and Ii be the number of executed instructions of type I for a given program. Then we can calculate an overall CPI as follows: CPI = The processor time T needed to execute a given program T = Ic * CPI * t
performance A common measure of performance for a processor is the rate at which instructions are executed, expressed as millions of instructions per second (MIPS), referred to as the MIPS rate. We can express the MIPS rate in terms of the clock rate and CPI as follows MIPS rate =Ic /T * 106 = f / CPI * 106
performance For example, consider the execution of a program which results in the execution of 2 million instructions on a 400-MHz processor. The program consists of four major types of instructions. The instruction mix and the CPI for each instruction type are given below based on the result of a program trace experiment: Instruction Type CPI Instruction Mix Arithmetic and logic 1 60% Load/store with cache hit 2 18% Branch 4 12% Memory reference with cache miss 8 10% T = Ic * CPI * t The average CPI when the program is executed on a uniprocessor with the above trace results is CPI= 0.6 +(2 *0.18) +(4* 0.12) +(8 *0.1) =2.24. The corresponding MIPS rate is =(400* 106) /(2.24 *106) =178.
MFLOPS Another common performance measure deals . Floating-point performance is expressed as millions of floating-point operations per second (MFLOPS), defined as follows only with floating-point instructions. Number of executed floating-point operations in a program MFLOPS = _______________________________________________ execution time * 106
Benchmarks • Programs designed to test performance • Written in high level language • Portable • Represents style of task • Systems, numerical, commercial • Easily measured • Widely distributed • E.g. System Performance Evaluation Corporation (SPEC) • CPU2006 for computation bound • 17 floating point programs in C, C++, Fortran • 12 integer programs in C, C++ • 3 million lines of code • Speed and rate metrics • Single task and throughput
SPEC Speed Metric • Single task • Base runtime defined for each benchmark using reference machine • Results are reported as ratio of reference time to system run time • Trefi execution time for benchmark i on reference machine • Tsuti execution time of benchmark i on test system • Overall performance calculated by averaging ratios for all 12 integer benchmarks • Use geometric mean • Appropriate for normalized numbers such as ratios • , , ∏xi = x1∙x2∙...∙xn
SPEC Rate Metric • Measures throughput or rate of a machine carrying out a number of tasks • Multiple copies of benchmarks run simultaneously • Typically, same as number of processors • Ratio is calculated as follows: • Trefi reference execution time for benchmark i • N number of copies run simultaneously • Tsuti elapsed time from start of execution of program on all N processors until completion of all copies of program • Again, a geometric mean is calculated
Amdahl’s Law • Gene Amdahl [AMDA67] • Potential speed up of program using multiple processors • Concluded that: • Code needs to be parallelizable • Speed up is bound, giving diminishing returns for more processors • Task dependent • Servers gain by maintaining multiple connections on multiple processors • Databases can be split into parallel tasks
Amdahl’s Law Formula • It deals with the potential speedup of a program using multiple processors compared to a single processor. • For program running on single processor • Fraction f of code infinitely parallelizable with no scheduling overhead • Fraction (1-f ) of code inherently serial • T is total execution time for program on single processor • N is number of processors that fully exploit parallel portions of code • Conclusions • When f is small, the use of parallel processors has little effect. • N ->∞, speedup is bound by 1/(1 – f) • So, diminishing returns for using more processors
References • AMDA67 Amdahl, G. “Validity of the Single-Processor Approach to Achieving Large-Scale Computing Capability”, Proceedings of the AFIPS Conference, 1967.