Download
1 / 45
450 likes | 527 Views
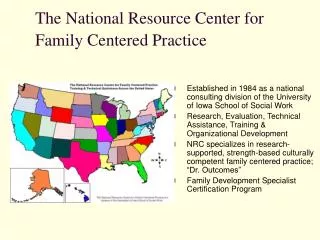
Using Family Centered Practice to Reduce Disproportionality. Patricia Parker, CSW National Resource Center for Family Centered Practice DMC Resource Center University of Iowa School of Social Work 100 Oakdale Campus, W206 Oakdale Hall Iowa City, Iowa 52242 Phone: 319/335-4965

E N D
Using Family Centered Practice toReduce Disproportionality Patricia Parker, CSW National Resource Center for Family Centered Practice DMC Resource Center University of Iowa School of Social Work 100 Oakdale Campus, W206 Oakdale Hall Iowa City, Iowa 52242 Phone: 319/335-4965 Email: pa_parker@msn.com
In the twenty-seven years I have worked at the Youth Law Center, the most pervasive, difficult, and intractable problem I have seen nationwide is racial and ethnic disparities faced by youth of color in the justice system.Mark Solar, No Turning Back, 10/2005
Our Future • According to the 2000 U.S. Census, approximately 30 percent of the population currently belongs to a racial or ethnic minority group. • The Census Bureau projects that by the year 2100, non-Hispanic whites will make up only 40 percent of the U.S. population U.S. Census Bureau
Minority Children: Our Future It is not news that, like many countries, the United States is becoming increasingly diverse. Between 1980 and 2000, the minority population in the United States grew 11 times as rapidly as the White, non-Hispanic population. Today, about one-third of the children and adolescents in the United States (under age 18) are people of color. By 2020, 45 percent of young people (birth to 18) are expected to be people of color. Source: Search Institute; Insights & Evidence. November, 2003, Vol 2, pp.1
A Juvenile is a Child First Juvenile • noun: a youthful person • adjective: of or relating to or characteristic of or appropriate for children or young people Child • Noun: young person of either sex • noun: a human offspring (son or daughter) of any age
“It is clear from the research that race plays a critical role at various decision points in the juvenile justice system. Family characteristics, socioeconomic status, education, and other socio-structural factors such as societal stereotyping further complicate the overrepresentation problem.” ~Anna McPhatter, PhD, 2002
The juvenile arrest rate for all offenses reached its highest level in the last two decades in 1996, and then declined 29% by 2002. Juvenile Arrest Rates for All Crimes, 1980-2002
Disparities between Girls and Boys • In 2001, “females accounted for 23% of juvenile arrests for aggravated assaults • 32% of juvenile arrests for other assaults” (Snyder, 2003). • arrest rates for girls between 1981 and 1997 rose 103% compared with a 27% increase for boys a greater number of delinquency cases for girls being referred to the court (68% increase) than for boys (40% increase).
Disparities between Girls and Boys • For girls, the disparate treatment of youth of color is also a significant factor in DMC. • Approximately two-thirds of the girls in the juvenile justice system are of color, primarily African American and Latina
Figure 3 AFRICAN AMERICAN JUVENILES ARE ARRESTED IN NUMBERS OUT OF PROPORTION TO THEIR REPRESENTATION IN THE GENERAL POPULATION 100% 80% 60% 40% 20% 0% Youth under age 18 Youth arrested 79 71 PERCENTAGE OF POPULATION ARRESTED 26 15 African American White RACE Source: Yamagata, Eileen Poe and Michael A. Jones. And Justice for Some: Differential Treatment of Minority Youth in the Justice System. Washington, DC: Building Blocks for Youth, April 2000.
Figure 5 AFRICAN AMERICAN YOUTH ARE ARRESTED AT TWICE THE RATE OF WHITE YOUTH 7,000 6,000 5,000 4,000 3,000 2,000 1,000 0 6,000 ARREST RATE (youth arrested per 100,000 in general population 3,000 African American White RACE Source: Yamagata, Eileen Poe and Michael A. Jones. And Justice for Some: Differential Treatment of Minority Youth in the Justice System. Washington, DC: Building Blocks for Youth, April 2000. U.S. Population Estimates by Age, Sex, Race, and Hispanic Origin: 1980-1999. Population Estimates Program, Population Divisions, U.S. Census Bureau, 2000.
Figure 6 WHITE YOUTH REPORT COMMITTING HIGHER LEVELS OF WEAPONS POSSESSION CRIMES, YET AFRICAN AMERICAN YOUTH ARE ARRESTED 2.5 TIMES THE RATE OF WHITES FOR WEAPONS OFFENSES WEAPONS POSSESSION CRIMES WEAPONS POSSESSION ARREST RATES 12% 10% 8% 6% 4% 2% 0% 3.0 2.5 2.0 1.5 1.0 .5 0 10 8 SELF-REPORTED CRIME RATE (in percentage) RATE PER 100,000 1.3 O.5 White African American White African American RACE RACE Source: Yamagata, Eileen Poe and Michael A. Jones. And Justice for Some: Differential Treatment of Minority Youth in the Justice System. Washington, DC: Building Blocks for Youth, April 2000. U.S. Population Estimates by Age, Sex, Race, and Hispanic Origin: 1980-1999. Population Estimates Program, Population Divisions, U.S. Census Bureau, 2000; Snyder, H. and M. Sickmund. Juvenile Offenders and Victims: 1999 National Report. Office of Juvenile Justice and Delinquency Prevention, U.S. Department of Justice, 1999.
Figure 7 WHITE YOUTH REPORT USING DRUGS AT 6 TO 7 TIMES THE RATE OF AFRICAN AMERICANS, BUT AFRICAN AMERICAN YOUTH ARE ARRESTED AT HIGHER RATES THAN WHITES FOR DRUG CRIMES 8.0% 7.0% 6.0% 5.0% 4.0% 3.0% 2.0% 1.0% 0.0% 8.0 7.0 6.0 5.0 4.0 3.0 2.0 1.0 0.0 12th graders Reported using cocaine 12th graders reported using crack 7.0 6.1 SELF-REPORTED CRIME RATE ARREST RATE FOR DRUG OFFENSES (per 100,000 in general population) 3.0 2.4 1.0 .5 African American African American White White RACE RACE Source: Yamagata, Eileen Poe and Michael A. Jones. And Justice for Some: Differential Treatment of Minority Youth in the Justice System. Washington, DC: Building Blocks for Youth, April 2000. U.S. Population Estimates by Age, Sex, Race, and Hispanic Origin: 1980-1999. Population Estimates Program, Population Divisions, U.S. Census Bureau, 2000; Monitoring the Future Report, 1975-1999, Volume I, Washington, DC: National Institute on Drug Abuse, 2000.
Figure 8 AFRICAN AMERICAN YOUTH ARE OVERREPRESENTED IN DRUG ARRESTS BUT UNDERREPRESENTED IN DRUG TREATMENT 100% 90% 80% 70% 60% 50% 40% 30% 20% 10% 0% Youth population Youth arrested for drug offenses Youth in treatment facilities 79 68 66 PERCENTAGE OF YOUTH 32 17 15 African American White RACE Source: Yamagata, Eileen Poe and Michael A. Jones. And Justice for Some: Differential Treatment of Minority Youth in the Justice System. Washington, DC: Building Blocks for Youth, April 2000. Treatment Episode Data Set (TEDS) 1998. Office of Applied Studies, Department of Health and Human Services, Substance Abuse and Mental Health Services Administration.
Figure 9 AFRICAN AMERICAN YOUTH ARESTED FOR DRUG OFFENSES ARE A THIRD LESS LIKELY TO BE DIVERTED TO DRUG TREATMENT FACILITIES 35% 30% 25% 20% 15% 10% 5% 0% 29 18 PERCENTAGE OF YOUTH ARRRESTED ON DRUG CHARGES DIVERTED BY THE COURT TO TREATMENT FACILITIES African American White RACE Source: Yamagata, Eileen Poe and Michael A. Jones. And Justice for Some: Differential Treatment of Minority Youth in the Justice System. Washington, DC: Building Blocks for Youth, April 2000. U.S. Population Estimates by Age, Sex, Race, and Hispanic Origin: 1980-1999. Population Estimates Program, Population Divisions, U.S. Census Bureau, 2000: Treatment Episode Data Set (TEDS), 1998. Office of Applied Studies, Department of Health and Human Services, Substance Abuse and Mental Health Services Administration.
Minority Children Are at Risk Living in America Infant mortality rate ( per 1,000) White Black 1964 21.6 42.3 2001 5.7 14.0 Children in Poverty( percent) 1965 14.4 93.8 2002 13.1 31.3 Children Defense Fund, 2004
Minority Children Are at Risk Living in America School Enrollment at age 16-17 (percent) White Black 1964 88.3 82.4 2002 92.8 91.4 High School dropouts 16-24 1967 15.4 28.6 2000 6.9 13.1 Children’s Defense Fund, 2004
Minority Children Are at Risk Living in America Teen Birth Rate White Black 1964 63.2 143.4 2002 39.4 66.6
Minority Children are Disproportionately Represented in Other Areas Misidentification in Special Education • In 29 States Black students <2x as likely a white to be labeled with emotional and behavioral disorders • In 39 states Black students <2x as likely to be labeled as mentally retarded • In 10 states Native American children are 2x as likely to be labeled mentally retarded than White children Children Defense Fund, 2004
Once labeled as disabled; • Black and Latino children are significantly less likely than white to receive special education services as mainstreamed students in an inclusive classroom • Black, Latino, and Native American children youths with disabilities were 67% more likely than whites youths to be removed on grounds of dangerousness by a hearing officer
Employment : ages 16-19 (% of pop.) all races Black Latino Jobless 6/1995 49.2 72.6 60.0 6/2004 59.8 77.5 68.6 Employment 6/1995 50.8 27.4 40.0 6/2004 40.2 22.5 31.4 (Bureau of Labor Statistics)
Living in Low Income Families*National Center for Children in Poverty. 8/2003
Child Welfare SystemRacial Disproportionality in the US Child Welfare Systems, Anne E. Casey Foundation, 2002
Strategies for Preventing Crime Committed by Children • Family-Based Preventive Interventions (Family Centered Practice) • School-Based Preventive Interventions • Community-Based Preventive Interventions
Recent Publications on Reducing DMC • No Turning Back : Promising Approaches to Reducing Racial and Ethnic Disparities Affecting Youth of Color in the Justice System; A Project of the Building Blocks for Youth Initiative, October 2005 • Seven Steps to Develop and Evaluate Strategies to Reduce Disproportionate Minority Contact (DMC) Juvenile Justice Evaluation Center Guidebook Series Office of Juvenile Justice and Delinquency Prevention Juvenile Justice Evaluation Center Justice Research and Statistics Association
Recent Publications on Reducing DMC • Guidebook for Integration and Coordination of Child Welfare and Juvenile Justice Systems (Wiig & Tuell 2005). CHILD WELFARE LEAGUE OF AMERICA • Disproportionate Minority Contact in the Juvenile Justice System CHILD WELFARE LEAGUE OF AMERICA
A Review of the Research “Primary and secondary prevention of delinquency rest on the principle of identifying individuals and environments at risk for delinquent activity before the behavior has occurred and then either removing risk factors or strengthening resistance to the risk factors.” by Edward P. Mulvey, Michael W. Arthur & N. Dickon Reppucci The Prevention Researcher 4 (2)
Burns Institute Founder James Bell …suggests that focusing on the following will reduce DMC: Policy Procedure Practice
Practice Family Centered Culturally Competent Strength Based
Strong Families • A core belief of Family Centered Practice is that “all families have strengths.” Allen,1990 • Children do better when their families do better. O’Hare,2002 • The success of our efforts to help families in crisis depends on our ability to match intervention plans with families' strengths and preferences.Van den Berg, 1997
The Strength Based Approach In 1998, Martin Seligman, Ph.D., a resiliency researcher and then President of the American Psychological Association, stated that the entire field of psychology is moving away from the deficit approach to a strengths-based model. Resiliency in Action: Practical Ideas for Overcoming Risks and Building Strengths in Youth, Families, & Communities.Resiliency In Action, Inc., 1999.
Strength- Based Beliefs • Families have the ability to overcome life’s adversities, with support. • Families that can hope can also grow and change. • All families have strengths that can be identified, enhanced and valued. • Interventions must build on the assessment of strength and resources as well as needs of the family.
Strength-Based Practitioners' Role (Erik Laurensen, ) • Focus on Strengths Rather than Weaknesses • Build Authentic Relationships with Children and Families • Respect children's and families' rights to self-determination • Believe That Change is Inevitable • Believe That All People and All Communities have Resources • Commit to Cultural Competence • Embrace Empowerment as a Process and a Goal • Team with Children, Families, and Other Professionals in the Reclaiming Process
Cultural Competence Defined Green (1999) argued that “cultural competence means only that the worker has a systematically-learned and tested awareness of the prescribed and proscribed values and behaviors of a specific community, and an ability to carry out professional activities consistent with that awareness “
Definition of Competence “Competence” implies having the capacity to function in a particular way, to have skills, to have a level of mastery in a situation. It is something to be achieved. This is why the word “competence” is preferred to the more passive terms of “awareness” and “sensitivity”. The Levels of Understanding: • Cultural Awareness is knowledge-based. • CulturalSensitivity is feeling/attitude-based. • Cultural Competence is behavior/skill-based.
Working definitions of culture are: • A set of coping skills and survival strategies that have evolved over time to help a group of people transact successfully within their environment or • A way of life in society, consisting of prescribed ways of behaving or norms of conduct, beliefs, values, and skills.
Defining Strong Families • Strong Families have a “set of relationships and processes that support and protect families and family members, especially during times of adversity and change”. • Family strengths help to maintain family cohesion while also supporting the development and well-being of individual family members.(Kids Count, 2002)
What Strong Families Report • Recently released study of African American and Latino/Latina parents in the United States: Building Strong Families 2004. • Prepared by the Search Institute and the YMCA of USA. • Source: www.abundantassets.org. • Data used with permission of the authors.
Family problem-solving communication Equality Spirituality Flexibility Truthfulness Hope Family hardiness Family time and routine Social support Health Source: I. H. McCubbin, et.al, 1997 Families Under Stress: What Makes Them Strong? General Resiliency Factors
Factors that effect a family’s ability to function at an optimal level… • Risk Factors • Those life elements that put the safety, permanence or well-being of a child and their family in danger. • Protective Factors • life events, experiences, or individuals that can reduce, moderate or eliminate the effect of exposure to risk factors. • Recovery Factors • Those supportive elements that work in concert with protective factors to restore or enable families to function at their optimal level
Examples of Risk, Protective, Recovery Factors • Risk Factors: poverty, crime, violence, addictions, domestic violence, disrupted families. • Protective Factors: employment, education, reunified family, spirituality, AA, NA. • Recovery Factors: family counseling, supportive services, financial assistance, skills training