Download
1 / 51
510 likes | 692 Views
Validation of the Radar Gust Equation used at the Kennedy Space Center and Cape Canaveral Air Force Station. Jared Rennie Radar Meteorology May 6 th , 2009. Outline. Introduction and Objectives Background Data and Methodology Results Conclusions Summary Questions.

E N D
Validation of the Radar Gust Equation used at the Kennedy Space Center and Cape Canaveral Air Force Station Jared Rennie Radar Meteorology May 6th, 2009
Outline • Introduction and Objectives • Background • Data and Methodology • Results • Conclusions • Summary • Questions
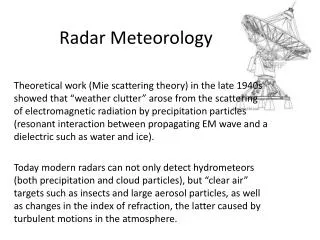
Introduction and Objectives • Convective Winds • Mesoscale / microscale events • Major aviation hazards • Hard to accurately predict • Concern for KSC and CCAFS • 45th Weather Squadron • Responsible for issuing convective wind advisories for thunderstorms in the area with the potential to produce wind gusts of 35 knots or greater • Many resources available
Introduction and Objectives (con’t) • Convectively driven winds • Originate from downbursts / microbursts from a storm cell • WSR-88D could be highly effective as a precursor for wind events
Introduction and Objectives (con’t) • Loconto (2006) • Created an equation using values from storm structure alpha-numeric text product • Possible issues • Only 44 cases used in creating equation • Only tested at or near the KSC / CCAFS area How well does this equation work in other areas across the United States?
Background • Storm Structure Alpha-Numeric Product • Past Research a) Stewart (1996) b) Sullivan (1999) c) Loconto (2006) - Radar project - Thesis
1) Storm Structure • Derived product on the WSR-88D • Archived by the National Climatic Data Center (NCDC) • Provides information about a particular storm cell on each successive scan • Derived from the storm cell investigation and tracking algorithm (SCIT)
1) Storm Structure (con’t) • SCIT Algorithm • Inputs volumetric base reflectivity and attempts to plot a three dimensional field of the storm cell • All cells are given an ID and are ranked by their cell based vertically integrated liquid • On next volume scan, algorithm will attempt to locate similarities and define a storm track • Success given same ID • Failure given new ID
1) Storm Structure (con’t) • Information for each storm cell • ID Number • Azimuth (degrees) • Range (nm) • Cell Base (kft) • Echo Top (kft) • Cell Based VIL (kg m-2) • Maximum Reflectivity (dBZ) • Height of the Maximum Reflectivity (kft)
1) Storm Structure (con’t) • VIL Density VIL Density = VIL ET Units are in kg m-3
2) Past Research • Stewart (1996) • created an equation to help determine the maximum downdraft speed of a microburst event based on level III radar data w = maximum predicted downdraft speed (ms-1) VIL = cell based vertically integrated liquid (kg m-2) ET = echo top (kft)
2) Past Research (con’t) • Sullivan (1999) • Evaluated three different predictive wind gust equations to see which one was the most effective at the Kennedy Space Center • Used KSC wind tower network and KMLB Storm Structure Data • Calculated Root Mean Square Error and Mean Average Error (MAE) for 15 microburst events
2) Past Research (con’t) • Results of Sullivan (1999) • Equation by Stewart (1996) best predicted the observed gust • Issues • Error values still large • RMSE of 11.9 kts • MAE of 9.7 kts • Statistical Significance? • Only 15 cases
2) Past Research (con’t) • Loconto (2006) • Updated results of Sullivan • Increased amount of events from 15 to 30 • Events were divided into two cases • 11 strong events (gusts greater than 50 kts) • 19 weak events (gusts between 35 and 49 kts)
2) Past Research (con’t) • Results of Loconto (2006) Show promise Still question of statistical significance New equation can be constructed
2) Past Research (con’t) • Loconto’s Thesis (2006) • Generated new equation • 44 cases • 30 met warning criteria (>= 35kts) • 14 did not meet criteria (< 35kts) • Calculated correlation coefficient between the KSC peak wind gust and all variables of the storm structure data (including VIL Density). • Concluded that the cell based VIL and maximum reflectivity are the best correlated
2) Past Research (con’t) • Loconto’s Thesis (2006) • Multiple Linear Regression Model • Using forward stepwise regression, created the following equation: GU = maximum peak wind gust (kts) VIL = cell based vertically integrated liquid (kg m-2) MaxZ = maximum reflectivity (dBZ) Height = height of MaxZ (kft)
2) Past Research (con’t) • Loconto’s Thesis (2006) • Validation of this equation • Independent set of twenty-two cases randomly selected and tested
2) Past Research (con’t) • Issues • Only 44 cases were selected • Has only been tested at or near the Kennedy Space Center • Other areas across the US experience convectively driven winds • Supercells in the midwest • Squall lines in the northeast
How well does Loconto’s radar gust equation accurately predict wind gusts from convective driven events across the United States?
Data and Methodology • Define three different areas • Florida • Tropical like airmass • Small scale forcing • Continental Interior • OK, KS, NE, SD, ND • Lee side of Rocky Mountains • Northeast Seacoast • Complex terrain • Summer time convective thunderstorms
Data and Methodology (con’t) • Two different datasets • True estimate of wind gust • Derived estimate of wind gust • Summer months of 2008 and 2007 • Twenty to thirty cases will be taken for each defined area • To ensure a wide variance of wind gusts, some will be below the KSC threshold of 35kts.
Data and Methodology (con’t) • Dataset 1: Storm Prediction Center • Storm reports of strong wind gusts • Values in mph • If there are multiple reports over the same area, the largest wind gust was recorded • Area mirrored with surface map to ensure wind was not synoptically driven • Many values marked as “UNK” • If location was near METAR and recorded valid wind gust within a valid timeframe, that value was used
Data and Methodology (con’t) • Dataset 2: Storm Structure Data • Nearest WSR-88D located • Volume scan at, or just before the time of the SPC report used • Java NEXRAD Data Viewer / Exporter used to locate cell nearest to SPC report • Storm Structure Data extracted • VIL Density calculated • Inserted VIL, MaxZ and Height into Loconto’s equation and outputted a wind gust.
Data and Methodology SPC Reported Gust: True Estimate Equation Generated Gust: Derived Estimate • Statistical tests applied for each area • Scatter plots • Correlation coefficient (R2) • Root Mean Square Error (RMSE) • Average Bias
Data and Methodology (con’t) • Multiple Linear Regression • Done for all three areas • Used to create a new location specific radar gust equation • Response • True estimate of the wind gust • Predictors • VIL, VIL Density, Echo Top, MaxZ, Height
Data and Methodology (con’t) • Multiple Linear Regression (con’t) • Variable Selection • Best Subsets function in Minitab • determine which variables are best fitted for a multiple linear regression model • Outputs • Correlation Coefficient • Mallows Cp • Standard Deviation • Once variables are selected • Equation is created • Analysis of Variance (ANOVA) generated
Data and Methodology (con’t) • Mallows Cp • Used to check for collinearity (over fitting or under fitting a particular model) • Value should be approximately equal to the number of predictors • ANOVA Table • Tests statistical significance of MLR model • Includes F-Statistic with p-value • Null Hypothesis: Variables do not explain variance of the wind gust • Alternative Hypothesis: Variables DO explain the variance of the wind gust
None of the cases above (including all three combined) were able to produce the same results in Loconto’s Thesis Equation may not be able to accurately predict wind gusts outside of the Cape Canaveral area
Multiple Linear Regression Correlation Coefficients for each area
MLR: Continental Interior VIL and VILD had the highest correlation coefficients Best Subsets Function: Predictors Used in Model Echo Top Maximum Reflectivity VIL Density
MLR: Continental Interior Gust= 60.0 + 0.523 Top - 1.02 MaxZ + 9.89 VILD Gust = Wind Gust for the Continental Interior (kts) Top = Echo Top (kft) MaxZ = Maximum Reflectivity (dBZ) VILD = VIL Density (kg m-3)
MLR: Florida VIL and VILD and MaxZ had the highest correlation coefficients Best Subsets Function: Predictors Used in Model Echo Top VIL VIL Density
MLR: Florida Gust = - 2.8 + 1.13 Top - 0.611 VIL + 10.4 VILD Gust = Wind Gust for Florida (kts) Top = Echo Top (kft) VIL = Cell Based Vertically Integrated Liquid (kg m-2) VILD = VIL Density (kg m-3)
MLR: Northeast Seacoast TOP and VIL had the highest correlation coefficients Best Subsets Function: Predictors Used in Model Echo Top VIL
MLR: Northeast Seacoast Gust = 17.6 + 0.240 Top + 0.620 VIL Gust = Wind Gust for the Continental Interior (kts) Top = Echo Top (kft) VIL = Cell Base Vertically Integrated Liquid (kg m-2)
Conclusions • Loconto’s equation • May not accurately predict convectively driven wind gusts across the US • Large RMSE and low correlation coefficients were shown • Errors possibly due to the fact all cases used for the equation were near the Kennedy Space Center • Is forty-four cases enough? • Motivation for thesis work
Conclusions (con’t) • Multiple Linear Regression Models Gust (Cont Int) = 60.0 + 0.523 Top - 1.02 MaxZ + 9.89 VILD Gust (Florida) = - 2.8 + 1.13 Top - 0.611 VIL + 10.4 VILD Gust (NE) = 17.6 + 0.240 Top + 0.620 VIL • Different variables are more important in different places • Echo Top used in all three, and height never used • Could be used as new area specific thresholds for predicting convective wind gusts • Because of time constraints, verification of these equations could not be assessed
Conclusions (con’t) • Issues • SCIT Algorithm • Dependent on Volume Control Pattern • Different VCP’s use different elevation angles • Could effect the parameters in the storm structure data…especially the cell based VIL • Assumed reported gust is true estimate • Not always case • How was it recorded (human? automated?) • Distance between report and storm cell?
Conclusions (con’t) • Issues 3) Data acquisition / analyzing subjective • Which SPC / METAR report to choose • Which cell was identified as the closest • Which predictors to run in the model 4) Statistical Significance • Only summer months of 2008 and 2007 used • Perhaps using storm structure products at more volume scans before the onset of report • Provide a better lead time of predicting wind gusts • Motivation for thesis work
Summary • Loconto’s equation attempts to predict convectively driven winds using data from storm cells via the WSR-88D • This research attempted to validate this equation over different areas of the US • Results showed that equation does not work fairly well, with high RMSE values and low correlation coefficients • More work may need to be done on this equation
Summary (con’t) • Multiple Linear Regressions were run in attempt to generate new equations for the defined areas • Models deemed statistically significant, and could be used as replacements • Many assumptions and bias were present, but can be used as a means of motivation for thesis work • Summer of 2009
References • Johnson, J.T., MacKeen, P.L., Witt, A., Mitchell, E.D., Stumpf, G.J., Eilts, M.D., and Thomas, K.W., 1998. The Storm Cell Identification and Tracking Algorithm: An Enhanced WSR-88D Algorithm. Weather and Forecasting, 13, 263-276. • Loconto, A.N., 2006. Improvements of Warm-Season Convective Wind Forecasts at the Kennedy Space Center and Cape Canaveral Air Force Station. M.S. Thesis, Dept. of Chemical, Earth, Atmospheric and Physical Sciences, Plymouth State University, Plymouth, NH. • ---, 2006 Prediction of Warm-Season Convective Wind Gusts at the Kennedy Space Center Using the Echo Top / VIL Wind Gust Potential Equation Radar Meteorology. • Stewart, S.R., 1996. Wet Microbursts—Predicting Peak Wind Gusts Associated with Summertime Pulse-Type Thunderstorms. Preprints, 15th Conf. on Weather and Forecasting. Amer. Meteor. Soc., 324-327. • Sullivan, G.D., 1999. Using WSR-88D to Forecast Convective Winds at the Kennedy Space Center and Cape Canaveral Air Station. M.S. thesis, Air Force Institute of Technology. 97 pp. • Wilks, D. S., 2005: Statistical Methods in the Atmospheric Sciences, Volume 91, Second Edition. Academic Press, 648.