Download
1 / 28
280 likes | 460 Views
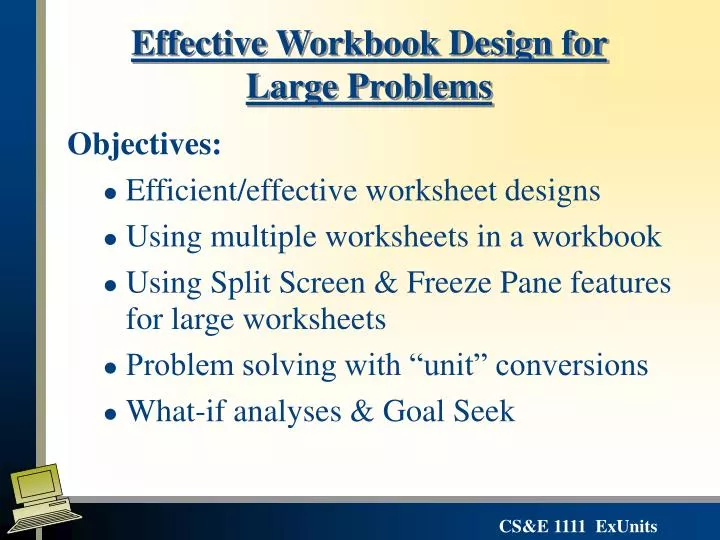
Effective Workbook Design for Large Problems. Objectives: Efficient/effective worksheet designs Using multiple worksheets in a workbook Using Split Screen & Freeze Pane features for large worksheets Problem solving with “unit” conversions What-if analyses & Goal Seek. A Problem:.

E N D
Effective Workbook Design for Large Problems • Objectives: • Efficient/effective worksheet designs • Using multiple worksheets in a workbook • Using Split Screen & Freeze Pane features for large worksheets • Problem solving with “unit” conversions • What-if analyses & Goal Seek
A Problem: Your Gardening Nursery business is growing and you need additional help. You need to determine if you will save money by hiring temporary employees vs. two full time employees. You have the following information: • Temporary employees are paid $10/hour flat rate. You estimate you will need a total of 80 work hours a week for each of the 50 weeks you are open. • Each permanent employee works 40 hours per week and is paid $1000 per month plus benefits worth $5000 per year. Each receives 2 weeks paid vacation while your store is closed in January - so they are paid for a full 12 months. You will need a total of 2 permanent employees.
Now Lets Implement This Problem in a Spreadsheet: ASingle Worksheet DesignIs Best With Limited Quantities Of Data By listing each input separately – it will be easy to make changes without worrying about where each value is used. data inputs calculations output
Designing a Spreadsheet SolutionUsing Multiple Worksheets • When creating spreadsheets with large amounts of related data it may be more effective to place each “table” of data in a separate location. • Excel provides us with the ability to have multiple worksheetswithin one workbook. Sheet tabs Sheets may be named and displayed with different colorstabs, The orderof the worksheets may be modified as well.
Referencing Cells on Multiple Worksheets • Syntax:Sheetname!Cell Reference • Formulas may include cell references from multiple worksheets:input!B1*input!B3 • When referencing a cell on the same spreadsheet as the active cell the sheet name is not required.C2+C3 • Named ranges are unique to a workbook. So if cell input!B1 is named ‘employee’ the formula in cell C3 could be written asemployee * input!B3 Formulas input calc
One method of organizing your data is withseparate sheets for inputs, calculations and/or outputs.This works well in the following instances: • Many different sheets share the same inputs – so each piece of data need only be changed in one location • When you want to present the results only on a single sheet comparing each of the different analyses The results of both analyses are presented on a single sheet input calc
Excel allows you to view multiple worksheets on your screen • If your worksheet is maximized • click on the Restore Window button. • Then size the window to easily view the contents of the worksheet using the sizing arrow from the edges of the window. • Open another window by selecting New Windows from the View Ribbon. • Select the next worksheet you desire to view and size it and place it on the screen so the contents is easy to view.
Another method of organizing workbooks is using separate sheets for different “cases” • This works well when: • Different cases have different input values • When you want to present the inputs/outputs and calculations of a single case on one sheet.
One advantage of using separate sheets for different “cases” is the ability to easily create summary sheets case1! case2! case3!
Editing Multiple Worksheets Simultaneously Whenmultiple worksheets are selected the Title bar adds[Group]to the title. Be careful when using groups not to inadvertently change something on another sheet that you didn’t want to.
Problems with Large Data Sets Consider a different example where you are analyzing a large dataset of gas prices.
Split Screen, Freeze Pane and Hide Tools • Split Screen creates sections that can each be independently scrolled. • Freeze Panes lets you freeze column and or row titles
Sometimes its not just the organization of the worksheets – but equating “units” in our problem solution Land development: Acres Square Feet Drapery fabric: Square Feet Square Yards Nutrition: Grams of Fat Calories Foreign Currency Exchange: Dollars Euros Interest: Annual Percentage Rate Daily Rate How do we mathematically convert units and how can Excel help us with this task?
Consider another Problem: You are a developer considering two adjacent pieces of property to purchase in order to construct homes on 10,000 SF plots. Which one is more cost effective cost per square foot? $100,000 for 10 Acres $120,000 for 40 10,000 SF plots OR
What information do you need? What information do you have? • Option 1 • Number of acres • Total dollars • 43,560 SF per acre • Option 2 • Number of plots • SF per plot • Total dollars Costs per SF Costs per SF
If you are given number of acres, andtotal dollarsand want$/SF what do you do? Option 1 Analysis Have: • Number of acres = 10 Total dollars = $100,000 • There are 43,560 SF per acre The same units in the numerator & the denominator cancel out * 43560 SF acre acres 10 = 435,600 SF $100,000 ÷ 435,600 SF = .23 $/SF
If you are given data indollars and wantdollars per square foot ($/SF) what do you do? Option 2 Analysis Have: • Number of plots = 40 • SF per plot = 10,000 • Total dollars = 120,000 $3000 $3000 When you divide, the denominator of a denominator becomes the numerator or alternatively multiply by 1 over the value plot plot plot $.30/SF 10,000 SF 10,000 SF $120,000 ÷ = $/Plot 3000 40 plots = plot
Now you can add or subtract like units to compare • Option 1 • Number of acres • Total dollars • 43,560 SF per acre • Option 2 • Number of plots • SF per plot • Total dollars .23 $/SF .30 $/SF Compare Like Units .30 $/SF - .23 $/SF = .07 $/SF Option 1 provides land at 7 cents per square foot less than the land in Option 2
By listing each input separately – it will be easy to perform what-if analyses Select aSingle Worksheet Design Implementation data inputs Intermediate calculations output
Another Example: Which car is the best buy after 5 years? • Car A costs $20,000 and gets 20 miles per gallon • Car B costs $25,000 and gets 30 miles per gallon • You can assume you drive an average of 12,000 miles per year and the cost of gas is $4/gallon Total Cost Purchase price + # years driven * Cost per year of gas
To get cost per year of gas we need to calculate the number of gallons per year? Multiplying miles/gallon by miles/year results in miles2/gallon-year • MilesMiles • Gallon Year x Dividing miles/gallon by miles per year the result is years/gallon • MilesMiles • Gallon Year ÷ Dividing miles/year by miles per gallon the result is gallons/year • MilesMiles • Year Gallon ÷
Cancel like units in the numerator & denominator. • Miles • Year • Gallons • Year • Miles • Gallon Units in the denominator of the denominator become the numerator • Gallons • Year • Dollar • Gallon • Dollars • Year x
Now complete the calculation Total Cost Purchase price + # years driven * Cost per year of gas • milesmiles • year gallon • dollars • gallon Cost of the car + # years x ÷ x =B6+C$3*(C$1/C6*C$2)
If you have an effective spreadsheet design – it is easy to create a What-if Analysis Change one or more input valuesaffected formulas are automatically recalculated By Modifying the miles per year and number of years all cells based on that value are automatically changed.
Goal Seekallows us to determine an Input Value that would be needed to get a Given Output • Allows us to work backwards in a worksheet • Lets you vary only one input variable • What-if analysis in the reverse direction. • Ex. What would the price of gas have to be to such that the total cost of the economy car (purchase + gas) is $30,000?
Goal Seek can be accessed from the Data Ribbon Tools Group If we want the value in D6to be $30000, what would the value in C2 ($/gal)have to be, assuming none of the other inputs change?
Design Your Worksheet: • A more complex example with multiple options • Calculations for each option are the same but input values vary • Want to compare inputs as well as final output Place inputs/outputs for each case on a single worksheet in an identical design, then use a summary worksheet • A more complex example • Inputs are shared between options and do not vary independently • Input may contain large datasets • Inputs with complex calculations • Want to compare outputs only • Separate inputs & outputs onto different worksheets • A simple example with very few options • The calculations for each option are different • Want to compare inputs as well as final output Use a single worksheet design
Some tips for designing your workbooks • Think before “typing” –organize your data, determine which inputs are likely to vary and which are fixed. • Unless you have a very simple problem - consider multiple worksheets for multi-table input/outputs or multiple cases. • Each data input should appear once and be used as a reference in subsequent calculations. Make sure you have correctly identified unit conversions and incorporated them into your solution • Document your workbooks - so that they can be easily understood by others