Download
1 / 4
40 likes | 151 Views
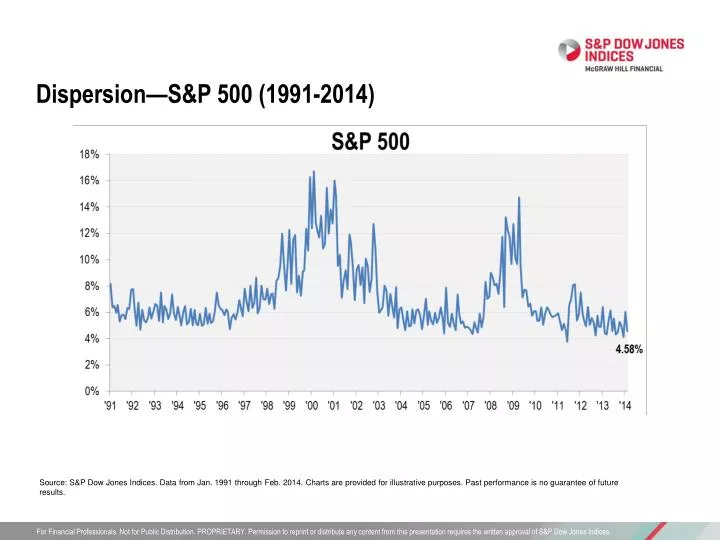
Dispersion—S&P 500 (1991-2014). Source: S&P Dow Jones Indices. Data from Jan. 1991 through Feb. 2014. Charts are provided for illustrative purposes. Past performance is no guarantee of future results. . S&P 500 Dispersion and SPIVA.

E N D
Dispersion—S&P 500 (1991-2014) Source: S&P Dow Jones Indices. Data from Jan. 1991 through Feb. 2014. Charts are provided for illustrative purposes. Past performance is no guarantee of future results.
S&P 500 Dispersion and SPIVA Source: S&P Dow Jones Indices. Data from 2003 through 2013. Charts are provided for illustrative purposes. Past performance is no guarantee of future results.
Global Dispersions Source: S&P Dow Jones Indices. Data from Jan. 2007 through Feb. 2014. Charts are provided for illustrative purposes. Past performance is no guarantee of future results.
Country and Sector Level Dispersion Source: S&P Dow Jones Indices. Data from Jan. 2009 through Feb. 2014. Charts are provided for illustrative purposes. Past performance is no guarantee of future results.