Download
1 / 60
610 likes | 1.01k Views
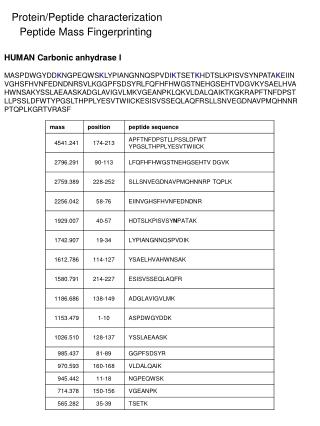
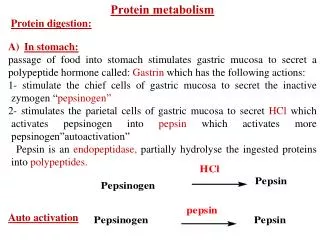
Protein digestion and peptide mass fingerprint (PMF) analysis. Yuanming Luo Institute of Microbiology,CAS. Protein digestion. In gel digestion On-membrane digestion In solution digestion. Two main approaches for digesting gel-separated proteins.

E N D
Protein digestion and peptide mass fingerprint (PMF) analysis Yuanming Luo Institute of Microbiology,CAS
Protein digestion • In gel digestion • On-membrane digestion • In solution digestion
Two main approaches for digesting gel-separated proteins • Protein blotting onto immobilizing membranes followed by on-membrane digestion (simpson et al., 1989; Gevaert and Vandekerckhove 2000) • Digesting proteins directly in the gel matrix and extracting the peptides (Ward et al., 1990)
Note: • The overall recoveries of peptides from in-gel digestion methods are significantly greater than that from on-membrane digestion strategies. • In-gel digestion might fail when the visualized protein is below~10mg of protein/cm2 (need a further concentration of weakly stained CBB gel spots (membrane spots) with electrophoresis in a new gel).
In gel digestion • 1. Excise the protein gel spots of interest and place in microfuge tube. • 2. Remove excess CBB by washing twice with 1 ml of either 0.1 M NH4HCO3, 50% acetonitrile. • 3. Dry each gel piece completely by speed Vac. The gel piece should not stick to the walls of the EP tube when completely dry.
In gel digestion (continued) • 4. Rehydrate the gel piece by adding 10ul of digestion buffer, containing 0.5ug of the appropriate protease, directly onto the dried gel piece. • 5. Store the gel pieces at 4℃ for over 45 min until the solution has been absorbed • 6. If necessary, repeat above two steps to allow the gel pieces to fully swell.
In gel digestion (continued) • 7. Add 20 ul of digestion buffer without protease to fully immerse the gel piece. • 8. Incubate for 12-16 hours at 37 ℃. • 9. Carefully remove the digestion buffer (now called the extract), and place it into a clean microfuge tube. The digestion buffer contains > 80% of the extractable peptides • 10. Add 200 ul of 5 %TFA/50% acetonitrile to the gel piece.
In gel digestion (continued) • 11. Incubate the tube with the gel piece for 1 hour at room temparature(37 ℃). • 12. Carefully remove the extract away from the gel piece and combine it with previous extract from step 9. • Repeat step 10,11,12 once again. • Concentrate the pooled extracts by speed Vac. Store the peptide extracts at -20 ℃ for future mass spectrometric analysis.
In gel digestion of silver-stained gels • Most of the steps of in gel digestion for silver-stained gels are the same except for the destaining solution which was prepared by mixing 30 mM potassium ferricyanide with 100 mM sodium thiosulfate (1:1 v/v).
On-membrane proteolytic digestion of electroblotted proteins • Proposed membranes are nitrocellulose membranes, because the hydrophobic surface of PVDF limits the recovery of peptide fragments. • Proposed dyes are Amido Black and Ponceau S, which are compatible with proteolytic digestion, peptide extraction from membrane and subsequent RP-HPLC analysis of peptides.
Electroblotting of staining the protein • 1. electroblot the proteins from the gel onto a nitrocellulose (for proteins that are difficult to transfer, add up to 0.005% SDS) • 2. stain the membrane with either Amido Black or Ponceau S. • E.g., for staining with Amido Black • A. immerse the nitrocellulose membrane in 0.1% Amido Black 10B for 1-3 minutes • B. Rapidly destain with several washes of H2O/acetic acid/ methanol.
Electroblotting of staining the protein (continued) • C. Rinse the destained blots thoroughly with deionized H2O to remove any excess acetic acid. • D. cut out the stained protein band (or for 2D gel spots, up to 40 spots from identical gels may be required) and transfer these bands to 1.5-ml microfuge tubes for immediate processing (begin with step 3) or for storage at -20℃.
For staining with Ponceau S • A. Immerse the nitrocellulose membrane in 0.1% Ponceau S for 1 minute. • B. Gently agitate the blot for 1-3 min in 1% acetic acid to remove excess stain. • C. Cut out the protein bands of interest and transfer them to microfuge tubes. • D.Destain the protein bands by washing the membrane pieces with 200 mM NaOH for 1-2 min. • E. Wash the membrane pieces with deionized H2O and process them immediately or store them wet at -20℃(avoid excessive drying).
Digestion of the membrane-bound proteins • 3. Add 1.2 ml of 0.5% (w/v) PVP-40 (which is used to prevent absorption of the protease to the nitrocellulose during digestion) in 100 mM acetic acid to each tube. • 4. Incubate the tube for 30 min at 37 ℃. • 5. Centrifuge the tube at ~1000g for 5 min. • 6. Remove the supernatant solution and discard.
7. Add ~1ml of H2O to the tube.(It is essential to remove excess PVP-40 before peptide mapping because of the strong UV absorbance of this detergent. Moreover, breakdown products of PVP-40 produce major contaminant peaks in ESI-MS) • 8. Votex the tube for 5 seconds. • 9. repeat step 5 and 6. • 10. repeat steps 7-9 five more times. • 11. cut the nitrocellulose strips into small pieces (~1x1mm) and place them in a fresh tube (0.5- or a 0.2-ml tube).
Digestion of the membrane-bound protein (continued) • 12. Add the minimal quantity of digestion buffer (10-20ml) to submerge the nitrocellulose pieces. • 13. After digestion, tryptically 16 hours or overnight at 37 ℃, load the total reaction mixture onto an appropriate RP-HPLC column for peptide fractionation (or store the peptide mixture at -20 ℃ until use).
Mass spectrometry involved in proteomics • Matrix-associated laser desorption ionization time of flight mass spectrometry (MALDI-TOF-MS) • Electrospray ionization (ESI) ion trap mass spetrometry • Surface-enhanced laser desorption ionization (SELDI) time of flight mass spetrometry (ProteinChip).
Linear and reflectron MALDI-TOF-MS • Linear MALDI-TOF-MS (lower accuracy) • Reflectron MALDI-TOF-MS: (1) higher accuracy, (2) Post-source decay (PSD), (3) delayed extraction
Mass spectrometry terms • Mass to charge (m/Z): Mass spectrometers measure the mass-to-charge values of molecular ions. • Resolution: resolution can be defined as the ability to separate and measure the masses of ions of similar, but not identical, molecular mass. • Signal to noise: • Monoisotopic mass versus average mass:
Natural Abundance of Isotopes Commonly Found in Proteins Atom Most Abundant Isotope Next Most Abundant Isotope Carbon 12C 98.9% 13C 1.11% Nitrogen 14N 99.6% 15N 0.366% Oxygen 16O 99.8% 18O 0.204% Sulfur 32S 95.0% 34S 4.22% What is the difference between monoisotopic and average peptide mass? • As shown in the table, below the atoms that make up the naturally occurring amino acids found in proteins are not isotopically pure.
MALDI difficulties • Salts and other contaminants • Selection of matrix • Sample itself • Crystallization • Calibration (external or internal cablibration) • Accuracy (ppm) • Resolution • Amount of protease
Dissolve the peptide mixture in 0.1%TFA. • Desalt by ZipTip C18 microcolumn (optional). • Directly elute the peptide mixture with -cyano-4-hydroxy cinnamic acid (CHCA) in 70% acetonitrile and spot the peptide mixture on sample plate. • The peptide mixtures cocrystallize with matrix on sample plate
Input of instrumental method and parameter setup • Calibration of spectrometer by external calibration • Crude spectrum • Tuning of parameters • Internal calibration of PMF spectra • Data processing for database search
Peptide and protein standards • Angiotensin II (human) MW: 1046.2 Substance P (human) MW: 1347.7 Insulin (bovine) MW: 5733.6 Cytochrom c (equine) MW: 12,360.1 RNase A (bovine) MW: 13,682.2 Apo-Myoglobin (equine) MW: 16,951.5 Trypsinogen (bovine) MW: 23,980.9
Recrystallization methods for MALDI matrices • Method 1: • Re-crystallization in 70% MeCN/30% water. • Heat a saturated solution of the matrix in 70% MeCN/30% water until boiling. • Carefully boil until solid dissolves completely. • Cool to room temp, then on ice - precipitate should form. • Filter precipitate.
Recrystallization methods for MALDI matrices • Method 2: • Protocol for re-crystallization of alpha-cyano-4-hyrdoxy-cinnamic acid • To 100mg of alpha-cyano-4-hydroxy-cinnamic acid, add 10ml of water • Add ammonium hydroxide until most of acid dissolves. • Slowly add concentrated HCl to the solution until a large amount of the acid has precipitated (about pH 2). • Remove the precipitate by centrifugation or filtering. • Wash the precipitate several times with 0.1M HCl. • Dry matrix and store at -20 C in the dark.
Calibration Used for calibration
It would be extremely difficult to measure a monoisotopic mass forBSA. In practice, most instruments report monoisotopic molecular weights up to a certain cut-off point. Above this cut-off, isotopic envelopes are centroided as a whole to provide average mass values.
Parameters setup of PMF • Instrument:Voyager DETM PRO BiospectrometryTM workstation, • Parameters: matrix:α-Cyano-4-hydroxycinnamic acid(CHCA) (1)delayed extraction, 150 ns、(2)reflector mode、(3)positive; (3)acceleration voltage: 20000 V;(4)Grid voltage75%;(5)Guide wire: 0.02%;(5)mass range: 800-3500 Da。
1746.906727 1768.874981 1803.789401 1807.994050 1815.963445 1816.950528 1820.832451 1903.003019 1944.068873 1945.050987 2132.706314 2148.959052 2163.051584 2203.054533 2344.153915 2722.314675 Mass list of annexin I (monoisotope) • 855.433556 • 908.444342 • 912.518921 • 936.511625 • 966.487904 • 982.482524 • 1011.539929 • 1064.543038 • 1092.608231 • 1213.550297 • 1262.595173 • 1523.808451 • 1543.863778 • 1640.800435 • 1649.789297 • 1651.894876 • 1724.838185