Download
1 / 28
280 likes | 412 Views
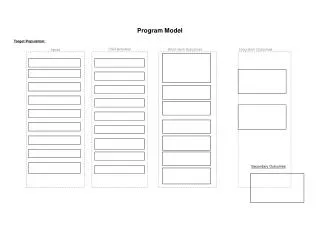
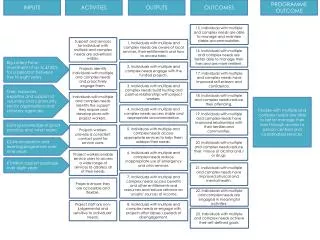
Phase 5 Model NPS Inputs. Methods and Calculations. Overview of Inputs. Attempt is to outline clearly defined input requirements that are easy to update. Nutrient Assimilative Capacity crop uptake, legumes, waste disposal Nutrient Sources

E N D
Phase 5 Model NPS Inputs Methods and Calculations
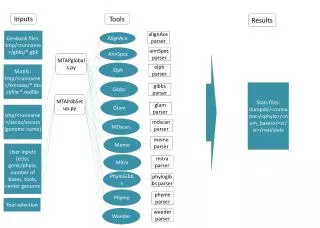
Overview of Inputs • Attempt is to outline clearly defined input requirements that are easy to update. • Nutrient Assimilative Capacity • crop uptake, legumes, waste disposal • Nutrient Sources • livestock, fertilizer, nitrogen fixation, septic systems, and animal nutrition • Nutrient Balances, BMPs, and Questions • fertilizer sales vs. nutrient management
Crop Uptake & Maximum Yield • HSPF Crop Parameters • Modeling Composite Crops • Ag. Census reports crop yield • STATSGO reports crop yield • 110% of max reported, or 130% of STATSGO yield (if reported yield is less than STATSGO) • Plant Nutrient Composition • Double-Cropping
Cropping Parameters in HSPF AGCHEM Module • The maximum total uptake for the entire growing season (NUPTGT, PUPTGT), • The fraction of total seasonal nutrient uptake for each month in the growing season under optimal growth conditions (MON-NUPT-FR1, MON-PUPT-FR1), and, • The ratio of maximum to optimal uptake rate for projecting opportunistic uptake by crops when growing conditions are sub-optimal (NMXRAT, PMXRAT). • The ratio of total crop uptake in any month in the portion of the plant biomass in a given soil layer – one table entry for each layer simulated.
Composite Crops • Um = the uptake of the composite crop land use for month m, • Ai = the area of crop i, • Uim = the uptake of crop i in month m, and • At = total area of the composite crop land use
Double-Crop Eligibility • Climate – USDA Cold Hardiness Zone 7 • Suitable Crops (corn, soy and grain) • Acres double-cropped – smallest of the two limiting crops: soy and grain.
Double Crop Maps Suitable Crop Rotations / Climate Modeled as Double-Crop
Double-cropping: Composite Corn, Winter Grain & Soy rotation • N = nutrient need per acre • Uc = Nutrient need for corn crop (lbs) • Us = Nutrient need for soybean • Ug = Nutrient Need for winter small grain • Ac = Acres of corn • Al = Acres of either soy or grain, whichever is larger
Modeling Legumes • Composite crop presents difficulties because it should not fix nitrogen all year long. • Model legume fixation as a sub-surface nutrient application during legume portion of growing season. • Amount fixed by legume calculated as portion of maximum uptake not satisfied by manure/fertilizer applications. • If more nitrogen is applied than crop need, no nitrogen is fixed. • Results in identical nitrogen loading rate to leguminous and non-leguminous land uses, difference is in where the loading is applied, and the frequency of application.
Nitrogen Fixation By Hay Chemical fertilizer applications on hay said to vary throughout the basin. Therefore, hay crop nitrogen is calculated with the following information: • Table of common hay types. • Percent of nitrogen fixed by each hay types. • Yield values for common hay types. • Nitrogen uptake of hay types. • Use STATSGO reported hays as default source for common hay types.
Nutrients Generated/Sold • Manure Nutrients • Effects of Phytase • Bio-solids • Fertilizer Sales • Septic Production
Assessing the Impact of Phytase: Necessary Input Data • Phosphorus content before the widespread adoption of phytase. • Phosphorus content after phytase. • Moisture content in the samples analyzed. • Are other dietary modifications being used (in addition to phytase)?
Phytase Reduction in Poultry Litter α – No breakdown of percentages between species, turkey normally has higher P excretions/unit waste. β - Pennsylvania submitted results of assessment given by a feed industry representative, est. 90% adoption. γ - Post-phytase data for West Virginia data was for the period 2001 to 2004, assume phytase adoption overlap.
Phytase Recommendations • Nutrient Team recommends the use of 20% as a conservative estimate of phytase effectiveness. • Adjustment should apply to all states, due to similarity in poultry industry players within the Chesapeake Bay region. • Mass-balance approach should help in determining future reductions due to dietary phosphorus reduction. • As-excreted data estimates will be adjusted to mirror the observed quantities: • Pre-phytase as-excreted = 0.3402 lbs-P/AU-day (77.2 lbs/dry ton), • Post-phytase as-excreted = 0.2698 lbs-P/AU-day (61.7 lbs/dry ton)
Other Studies on Phytase Reductions when control group in phytase study where animal received ONLY phytase, no other dietary modifications generally do not exceed 23-24%: • 23% reduction –. Phytase Supplementation and Reduced-Phosphorus Turkey Diets Reduce Phosphorus Loss in Runoff following Litter Application.Maguire, Sims and Applegate, 2004. Journal of Environmental Quality 34:359-369. • 23% reduction - Total and water-soluble phosphorus in broiler litter over three flocks with alum litter treatment and dietary inclusion of high available phosphorus corn and phytase supplementation. Miles, D.M., P.A. Moore, D.R. Smith, D.W. Rice, H.L. Stilborn, D.R. Rowe, B.D. Lott, S.L. Branton, and J.D. Simmons. 2003. Poultry Science 82:1544–1549. • 10-24% reduction - Influence of phytase addition to poultry diets on phosphorus forms and solubility in litters and amended soils. Maguire, R.O., J.T. Sims, W.W. Saylor, B.L. Turner, R. Angel, and T.J. Applegate. 2004. Journal of Environmental Quality 33:2306–2316.
Calculating Rate of fertilizer sales • Sales vary from year to year. • Sales are reported in month 6 and month 12, could result in some shifting of purchases, and inconsistency in resulting rates. • Calculated an average basin-wide rate, due to difficulty with county wide, and even state-wide totals for small states. • Fertilizer application related to target crop yield and perceived application rate to achieve that yield.
Target Yield and Crop Need • F = R • Y • U - (M + L) • R = Maximum Yield Rate Multiplier • F = fertilizer application • Y = Maximum achievable yield • U = Uptake per yield Unit (non-leguminous) • M = Manure Nutrients • L = Legume residual from previous crop • R = (K • S) • K = target yield percent of maximum yield • S = application versus uptake rate multiplier • Solving for R yields: • R = (F + M + L)/(Y * U)
Implications of Fertilizer Sales • Phosphorus rates have declined on a per acre basis. • Nitrogen rates have remained essentially steady, either: • Pre-condition for nutrient management rate is not far from post-condition. • Crop Yields have risen over time, resulting in more nitrogen demand.
Effects of Modeling Nutrient Managed Lands at < Max Yield • In 2002, approximately 50% of crop land is under nutrient management plans basin wide. (3.8 Million acres of crop land, out of a total of nearly 8.0 million acres) • Given a steady rate factor (R) for land as a whole, modeling nutrient managed lands at a lower than maximum target yield results in increasing loads on non-nutrient managed land.
Nutrient Management Modeling Recommendations • Use Fertilizer Sales data to determine changes in R, K and S over time. • Choose K = 1.0 in equation R = K * S until data shows a decrease • Obtain annual yield data for improved sense of increases in crop yield over time.
Septic Effluent • Point Source Work group recommends attenuation factor be changed to 40% from 60% (7/29/2004). • Newer research suggests that septic effluent concentration is approximately 48.7 mg/L (mean of kitchen and non-kitchen waste). • Phosphorus not currently counted in the model, leading to an increase of P to the bay when sewer connection is made. • Can Phosphorus saturation and subsequent loss occur over the long term with septic? • Delaware TMDL implementation guidelines suggest 0.0013 lb-P/day/system reaches edge of stream.
High Low Septic Loading Rate Total Number of Systems Systems per acre Low-Density • Septic accounts for approximately 4% of total N produced in the watershed. Darker color indicates higher density (period shown is 2000).
Application versus Assimilation: Where the rubber meets the fan • The methods thus far used result in an uptake based application scheme with a uniform rate multiplier throughout the basin, except in areas where there are excess manure nutrients.
Percent of Crop Need P Map of Assimilative Capacity versus Available nutrients Percent of Crop Need N Nutrient Managed Composite Non-Nutrient Managed Composite