Download

1 / 68
770 likes | 2.6k Views
OPTIMIZATION TECHNIQUES IN PHARMACEUTICAL FORMULATION AND PROCESSING. Assoc.Prof . S.S.Mani Kiran M. Pharm., Ph. D Department of Pharmaceutics Chalapathi Institute of Pharmaceutical Sciences, Guntur. CONTENTS. CONCEPT OF OPTIMIZATION OPTIMIZATION PARAMETERS CLASSICAL OPTIMIZATION

E N D
OPTIMIZATION TECHNIQUES IN PHARMACEUTICAL FORMULATION AND PROCESSING Assoc.Prof. S.S.ManiKiranM. Pharm., Ph. D Department of Pharmaceutics Chalapathi Institute of Pharmaceutical Sciences, Guntur CIPS Guntur
CONTENTS • CONCEPT OF OPTIMIZATION • OPTIMIZATION PARAMETERS • CLASSICAL OPTIMIZATION • STATISTICAL DESIGN • DESIGN OF EXPERIMENT • OPTIMIZATION METHODS CIPS Guntur
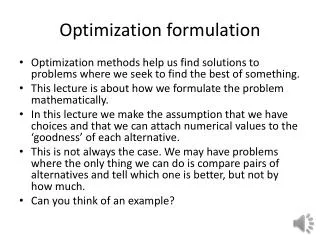
INTRODUCTION • The term Optimize is defined as “to make perfect”. • It is used in pharmacy relative to formulation and processing • Involved in formulating drug products in various forms • It is the process of finding the best way of using the existing resources while taking in to the account of all the factors that influences decisions in any experiment CIPS Guntur
INTRODUCTION • Final product not only meets the requirements from the bio-availability but also from the practical mass production criteria • Pharmaceutical scientist- to understand theoretical formulation. • Target processing parameters – ranges for each excipients & processing factors CIPS Guntur
INTRODUCTION • In development projects , one generally experiments by a series of logical steps, carefully controlling the variables & changing one at a time, until a satisfactory system is obtained • It is not a screening technique. CIPS Guntur
Optimization parameters Optimization parameters Problem types Variable Constrained Unconstrained Dependent Independent CIPS Guntur
Optimization parameters VARIABLES Independent Dependent Formulating Processing Variables Variables CIPS Guntur
Optimization parameters • Independent variables or primary variables : Formulations and process variables directly under control of the formulator. These includes ingredients • Dependent or secondary variables : These are the responses of the inprogress material or the resulting drug delivery system. It is the result of independent variables . CIPS Guntur
Optimization parameters • Relationship between independent variables and response defines response surface • Representing >2 becomes graphically impossible • Higher the variables , higher are the complications hence it is to optimize each & everyone. CIPS Guntur
Optimization parameters • Response surface representing the relationship between the independent variables X1 and X2 and the dependent variable Y. CIPS Guntur
Classic optimization • It involves application of calculus to basic problem for maximum/minimum function. • Limited applications i. Problems that are not too complex ii. They do not involve more than two variables • For more than two variables graphical representation is impossible • It is possible mathematically CIPS Guntur
GRAPH REPRESENTING THE RELATION BETWEEN THE RESPONSE VARIABLE AND INDEPENDENT VARIABLE CIPS Guntur
Classic optimization • Using calculus the graph obtained can be solved. Y = f (x) • When the relation for the response y is given as the function of two independent variables,x1 &X2 Y = f(X1 , X2) The above function is represented by contour plots on which the axes represents the independent variables x1& x2 CIPS Guntur
Statistical design • Techniques used divided in to two types. • Experimentation continues as optimization proceeds It is represented by evolutionary operations(EVOP), simplex methods. • Experimentation is completed before optimization takes place. It is represented by classic mathematical & search methods. CIPS Guntur
Statistical design • For second type it is necessary that the relation between any dependent variable and one or more independent variable is known. • There are two possible approaches for this • Theoretical approach- If theoretical equation is known , no experimentation is necessary. • Empirical or experimental approach – With single independent variable formulator experiments at several levels. CIPS Guntur
Statistical design • The relationship with single independent variable can be obtained by simple regression analysis or by least squares method. • The relationship with more than one important variable can be obtained by statistical design of experiment and multi linear regression analysis. • Most widely used experimental plan is factorial design CIPS Guntur
TERMS USED • FACTOR: It is an assigned variable such as concentration , Temperature etc.., • Quantitative: Numerical factor assigned to it Ex; Concentration- 1%, 2%,3% etc.. • Qualitative: Which are not numerical Ex; Polymer grade, humidity condition etc • LEVELS: Levels of a factor are the values or designations assigned to the factor CIPS Guntur
TERMS USED • RESPONSE: It is an outcome of the experiment. • It is the effect to evaluate. • Ex: Disintegration time etc.., • EFFECT: It is the change in response caused by varying the levels • It gives the relationship between various factors & levels • INTERACTION: It gives the overall effect of two or more variables Ex: Combined effect of lubricant and glidant on hardness of the tablet CIPS Guntur
TERMS USED • Optimization by means of an experimental design may be helpful in shortening the experimenting time. • The design of experiments is a structured , organised method used to determine the relationship between the factors affecting a process and the output of that process. • Statistical DOE refers to the process of planning the experiment in such a way that appropriate data can be collected and analysed statistically. CIPS Guntur
TYPES OF EXPERIMENTAL DESIGN • Completely randomised designs • Randomised block designs • Factorial designs • Full • Fractional • Response surface designs • Central composite designs • Box-Behnken designs • Adding centre points • Three level full factorial designs CIPS Guntur
TYPES OF EXPERIMENTAL DESIGN • Completely randomised Designs • These experiment compares the values of a response variable based on different levels of that primary factor. • For example ,if there are 3 levels of the primary factor with each level to be run 2 times then there are 6 factorial possible run sequences. • Randomised block designs • For this there is one factor or variable that is of primary interest. • To control non-significant factors,an important technique called blocking can be used to reduce or eliminate the contribition of these factors to experimental error. CIPS Guntur
TYPES OF EXPERIMENTAL DESIGN • Factorial design • Full • Used for small set of factors • Fractional • It is used to examine multiple factors efficiently with fewer runs than corresponding full factorial design • Types of fractional factorial designs • Homogenous fractional • Mixed level fractional • Box-Hunter • Plackett-Burman • Taguchi • Latin square CIPS Guntur
TYPES OF EXPERIMENTAL DESIGN • Homogenous fractional • Useful when large number of factors must be screened • Mixed level fractional • Useful when variety of factors need to be evaluated for main effects and higher level interactions can be assumed to be negligible. • Box-hunter • Fractional designs with factors of more than two levels can be specified as homogenous fractional or mixed level fractional CIPS Guntur
TYPES OF EXPERIMENTAL DESIGN Plackett-Burman • It is a popular class of screening design. • These designs are very efficient screening designs when only the main effects are of interest. • These are useful for detecting large main effects economically ,assuming all interactions are negligible when compared with important main effects • Used to investigate n-1 variables in n experiments proposing experimental designs for more than seven factors and especially for n*4 experiments. CIPS Guntur
TYPES OF EXPERIMENTAL DESIGN • Taguchi • It is similar to PBDs. • It allows estimation of main effects while minimizing variance. • Latin square • They are special case of fractional factorial design where there is one treatment factor of interest and two or more blocking factors CIPS Guntur
Response surface designs • This model has quadratic form • Designs for fitting these types of models are known as response surface designs. • If defects and yield are the ouputs and the goal is to minimise defects and maximise yield γ =β0 + β1X1 + β2X2 +….β11X12 + β22X22 CIPS Guntur
TYPES OF EXPERIMENTAL DESIGN • Two most common designs generally used in this response surface modelling are • Central composite designs • Box-Behnken designs • Box-Wilson central composite Design • This type contains an embedded factorial or fractional factorial design with centre points that is augemented with the group of ‘star points’. • These always contains twice as many star points as there are factors in the design CIPS Guntur
TYPES OF EXPERIMENTAL DESIGN • The star points represent new extreme value (low & high) for each factor in the design • To picture central composite design, it must imagined that there are several factors that can vary between low and high values. • Central composite designs are of three types • Circumscribed(CCC) designs-Cube points at the corners of the unit cube ,star points along the axes at or outside the cube and centre point at origin • Inscribed (CCI) designs-Star points take the value of +1 & -1 and cube points lie in the interior of the cube • Faced(CCI) –star points on the faces of the cube. CIPS Guntur
Box-Behnken design • They do not contain embedded factorial or fractional factorial design. • Box-Behnken designs use just three levels of each factor. • These designs for three factors with circled point appearing at the origin and possibly repeated for several runs. CIPS Guntur
Three-level full factorial designs • It is written as 3k factorial design. • It means that k factors are considered each at 3 levels. • These are usually referred to as low, intermediate & high values. • These values are usually expressed as 0, 1 & 2 • The third level for a continuous factor facilitates investigation of a quadratic relationship between the response and each of the factors CIPS Guntur
FACTORIAL DESIGN • These are the designs of choice for simultaneous determination of the effects of several factors & their interactions. • Used in experiments where the effects of different factors or conditions on experimental results are to be elucidated. • Two types • Full factorial- Used for small set of factors • Fractional factorial- Used for optimizing more number of factors CIPS Guntur
LEVELS OF FACTORS IN THIS FACTORIAL DESIGN CIPS Guntur
EXAMPLE OF FULL FACTORIAL EXPERIMENT CIPS Guntur
EXAMPLE OF FULL FACTORIAL EXPERIMENT a + ab + ac + abc (1) + b + c + bc _ 4 4 [487 + 426 + 456 + 522 – (475 + 421 + 525 + 472)] 10-3 • Calculation of main effect of A (stearate) • The main effect for factor A is • {-(1)+a-b+ab-c+ac-bc+abc] X 10-3 • Main effect of A = = = 0.022 cm 4 CIPS Guntur
EFFECT OF THE FACTOR STEARATE Average = 495 * 10-3 500 490 480 Average = 473 * 10-3 470 0.5 1.5 CIPS Guntur
STARCH X STEARATE INTERACTION High stearate(1.5 mg) High starch(50mg) 500 Low Stearate(0.5 mg) 500 Thickness 450 Low starch(30mg) 450 Starch Stearate CIPS Guntur
General optimization • By MRA the relationships are generated from experimental data , resulting equations are on the basis of optimization. • These equation defines response surface for the system under investigation • After collection of all the runs and calculated responses ,calculation of regression coefficient is initiated. • Analysis of variance (ANOVA) presents the sum of the squares used to estimate the factor maineffects. CIPS Guntur
FLOW CHART FOR OPTIMIZATION CIPS Guntur
Applied optimization methods • Evolutionary operations • Simplex method • Lagrangian method • Search method • Canonical analysis CIPS Guntur
Evolutionary operations (evop) • It is a method of experimental optimization. • Technique is well suited to production situations. • Small changes in the formulation or process are made (i.e.,repeats the experiment so many times) & statistically analyzed whether it is improved. • It continues until no further changes takes place i.e., it has reached optimum-the peak CIPS Guntur
Evolutionary operations (evop) • Applied mostly to TABLETS. • Production procedure is optimized by careful planning and constant repetition • It is impractical and expensive to use. • It is not a substitute for good laboratory scale investigation CIPS Guntur
Simplex method • It is an experimental method applied for pharmaceutical systems • Technique has wider appeal in analytical method other than formulation and processing • Simplex is a geometric figure that has one more point than the number of factors. • It is represented by triangle. • It is determined by comparing the magnitude of the responses after each successive calculation CIPS Guntur
Graph representing the simplex movements to the optimum conditions CIPS Guntur
Simplex method • The two independent variables show pump speeds for the two reagents required in the analysis reaction. • Initial simplex is represented by lowest triangle. • The vertices represents spectrophotometric response. • The strategy is to move towards a better response by moving away from worst response. • Applied to optimize CAPSULES, DIRECT COMPRESSION TABLET (acetaminophen), liquid systems (physical stability) CIPS Guntur
Lagrangian method • It represents mathematical techniques. • It is an extension of classic method. • It is applied to a pharmaceutical formulation and processing. • This technique follows the second type of statistical design • Limited to 2 variables - disadvantage CIPS Guntur
Steps involved • Determine objective formulation • Determine constraints. • Change inequality constraints to equality constraints. • Form the Lagrange function F: • Partially differentiate the lagrange function for each variable & set derivatives equal to zero. • Solve the set of simultaneous equations. • Substitute the resulting values in objective functions CIPS Guntur
Example • Optimization of a tablet. • phenyl propranolol(active ingredient)-kept constant • X1 – disintegrate (corn starch) • X2 – lubricant (stearic acid) • X1 & X2 are independent variables. • Dependent variables include tablet hardness, friability ,volume, invitro release rate e.t.c.., CIPS Guntur
Example • Polynomial models relating the response variables to independents were generated by a backward stepwise regression analysis program. • Y= B0+B1X1+B2X2+B3 X12 +B4 X22 +B+5 X1 X2 +B6 X1X2 + B7X12+B8X12X22 Y – Response Bi – Regression coefficient for various terms containing the levels of the independent variables. X – Independent variables CIPS Guntur
Tablet formulations CIPS Guntur
Tablet formulations • Constrained optimization problem is to locate the levels of stearic acid(x1) and starch(x2). • This minimize the time of invitro release(y2),average tablet volume(y4), average friability(y3) • To apply the lagrangian method, problem must be expressed mathematically as follows Y2 = f2(X1,X2)-invitro release Y3 = f3(X1,X2)<2.72-Friability Y4 = f4(x1,x2) <0.422-avg tab.vol CIPS Guntur