Download
1 / 23
230 likes | 420 Views
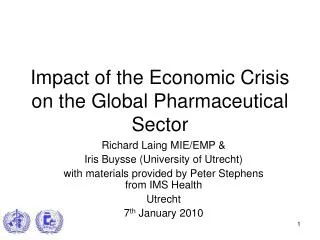
Impact of the Economic Crisis on the Global Pharmaceutical Sector . Richard Laing MIE/EMP & Iris Buysse (University of Utrecht) with materials provided by Peter Stephens from IMS Health Utrecht 7 th January 2010. In the 97-99 Asian crisis consumption declines lagged GDP decline. . ,.

E N D
Impact of the Economic Crisis on the Global Pharmaceutical Sector Richard Laing MIE/EMP & Iris Buysse (University of Utrecht) with materials provided by Peter Stephens from IMS Health Utrecht 7th January 2010
In the 97-99 Asian crisis consumption declines lagged GDP decline. , Real GDP (LCU) (Q2 ’97=1) Drug Consumption (SU) (Q2 ’97=1) 1.4 1.4 1.3 1.3 Korea 1.2 1.2 1.1 1.1 Thailand Thailand Indonesia Indonesia 1.0 1.0 0.9 Korea 0.9 0.8 0.0 0.0 # of Quarters Q0 = Q2 ’97 # of Quarters Q0 = Q2 ’97 Source: ???? Source: IMS Midas
, Chronic disease consumption recovered quicker than overall consumption. Real GDP (LCU) (Q2 ’97=1) Chronic Disease Consumption (SU) (Q2 ’97=1) 1.4 1.4 1.3 1.3 Korea 1.2 1.2 Thailand 1.1 Korea 1.1 Thailand Indonesia Indonesia 1.0 1.0 0.9 0.9 0.8 0.0 0.0 # of Quarters Q0 = Q2 ’97 # of Quarters Q0 = Q2 ’97 Source: WHO Source: IMS Midas
, Acute disease drug consumption recovers more slowly than GDP. Real GDP (LCU) (Q2 ’97=1) Acute Disease Consumption (SU) (Q2 ’97=1) 1.4 1.4 1.3 1.3 1.2 Korea 1.2 1.1 Indonesia 1.1 Thailand 1.0 Indonesia Thailand 0.9 1.0 0.8 0.9 0.7 Korea 0.0 0.0 # of Quarters Q0 = Q2 ’97 # of Quarters Q0 = Q2 ’97 Source: WHO Source: IMS Midas
The WHO, in collaboration with IMS, has established a programme to monitor the impact of the 08/09/?? recession 83 countries, approximately 81% of global population, quarterly reports (Small, poor and African countries missing) Impact on consumption (Lagging indicator) Total volume Volume of acute and chronic medicines Movement to or from original and licensed branded medicines Impact on expenditure (Leading indicators) Total expenditure Average price per unit of volume (SU)
IMS Data Sources and Analysis Methods IMS collects data on consumption and prices at one point in the distribution channel. Data generally collected from private sector but in many countries the private sector supplies the public sector. Generally do not capture tender data In some countries only captures hospital data (e.g. China) Uses the same point and methods in each country, so good for detecting changes less so for cross country comparisons Volume data is more reliable than pricing data
Next steps • Pareto analysis on ATC2 and ATC3-level on consumption distribution for 6 most affected countries • ATC-2 & 3 level analysis to identify top and bottom 10 of most decline • Investigate whether Individual product level data can identify marker medicines within ATC4 categories
Example of distribution of ATC3 categories of total consumption in IMS supply units
Q4 07-Q1 08 compared to Q4 08-Q1 09ATC2: Top 10 decliners of the 30% of categories that account for 80% of consumption
Q4 07-Q1 08 compared to Q4 08-Q1 09ATC2: Bottom 10 decliners of the 30% of categories that account for 80% of consumption
Work underway to be presented on January 8th by Iris Buysse • ATC2 analysis • Identification of marker product categories for detecting declines that are likely to be therapeutically significant • More work to be done on ATC3 and ATC 4 data
Further work to be undertaken in 2010 • Meet to discuss further work to be done in Baltic states to link IMS consumption data with social security utilization & claims data. Possibly involve Iceland • Interim report for WHO Executive Board 2010 • Full report for World Health Assembly 2010 • Source data available on request for further analysis
Conclusions of IMS reports to date No firm evidence of a negative impact except in Baltic countries and Malaysia So far most countries seem to have absorbed the moderate price increases without a loss in medicine consumption Confident that the data collection methods and the analytic tools available will enable us to detect significant changes as soon as they occur When such changes are detected, governments have a range of policy instruments to alleviate the situation More reports will be provided quarterly http://www.who.int/medicines/areas/policy/imsreport/en/index.html