Download
1 / 53
530 likes | 706 Views
The Changing Population of Texas and West Texas. Cross Roads Health Care Transformation in West Texas Conference June 5, 2013 Lubbock, Texas. Growing States, 2000-2010. 65% (2.8 million) of this change can be attributed to growth of the Hispanic population.

E N D
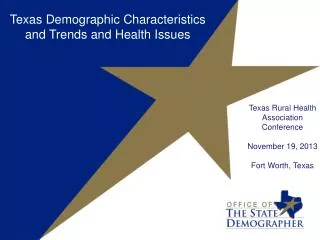
The Changing Population of Texas and West Texas Cross Roads Health Care Transformation in West Texas Conference June 5, 2013 Lubbock, Texas
Growing States, 2000-2010 65% (2.8 million) of this change can be attributed to growth of the Hispanic population Source: U.S. Census Bureau. 2000 and 2010 Census Count.
Total Population and Components of Population Change in Texas, 1950-2012
Total Estimated Population by County, 2012 Along and east of I-35: 40% of land 85% of population 92% of population growth (2011-2012) Source: U.S. Census Bureau 2012 Population Estimates
Change of the Total Population by County, 2000 to 2010 79 counties lost population over the decade Source: U.S. Census Bureau 2000 and 2010 Census Counts
Change of the Total Population by County, 2010 to 2012 96 counties lost population over the two year period Of counties that lost population 90% had net out migration 47% had natural decline Source: U.S. Census Bureau Population Estimates, 2012 Vintage.
The 10 Fastest Growing Metro AreasIncrease from July 1, 2011, to July 1, 2012 Source: U.S. Census Bureau, 2012
The 10 Counties with the Largest Numeric Increase from July 1, 2011, to July 1, 2012 Source: U.S. Census Bureau, 2013
Percent employed in Agriculture, Forestry, Fishing Source: U.S. `Census Bureau, American Community Survey, 5-Year Sample, 2007-2011
Estimated domestic migration by county, 2000-2010 Source: Population Division, U.S. Census Bureau, 2012. Map produced by the Texas State Data Center
Estimated internationalmigration by county, 2000-2010 Source: Population Division, U.S. Census Bureau, March 19, 2009. Map produced by the Texas State Data Center
States with Largest Estimated Unauthorized Immigrant Populations, 2010 6.5% of Texas’ 2010 Population Source: Pew Hispanic Center estimates based on residual methodology applied to March Supplements to the Current Population Survey (February 1, 2011).
Estimated percent population change, 2011-2012, Texas Incorporated Places
Estimated percent population change, 2011-2012, Texas Incorporated Places
Estimated percent population change, 2011-2012, Texas Incorporated Places
Estimated percent population change, 2011-2012, Texas Incorporated Places
Texas Racial and Ethnic Composition, • 2000 and 2010 Source: U.S. Census Bureau. 2000 and 2010 Census count
Racial and Ethnic Composition, Texas and High Plains GOG Counties, 2010 Texas 1. High Plains Source: U.S. Census Bureau. 2010 Census SF1
Racial and Ethnic Composition, Texas and Williamson County 2010 Texas 38% Hispanic 45% NH White 11% NH Black 6% NH Other 11. West Texas 2. North West Source: U.S. Census Bureau. 2010 Census SF1
Texas White (non-Hispanic) and Hispanic Populations by Age, 2010 Source: U.S. Census Bureau 2010 Decennial Census, SF1
Texas Population Pyramid by Race/Ethnicity, 2010 Source: U.S. Census Bureau 2010 Decennial Census, SF1
Texas Population Pyramid by Race/Ethnicity, 2010 Source: U.S. Census Bureau 2010 Decennial Census, SF1
Texas Population Pyramid by Race/Ethnicity, 2010 Source: U.S. Census Bureau 2010 Decennial Census, SF1
Lubbock County Population Pyramid, 2011 Source: U.S. Census Bureau, County Population Estimates, 2011
Crosby, Floyd, Garza, Hale, Hockley, Lamb, Lynn, Terry Counties Population Pyramid, 2011 Source: U.S. Census Bureau, County Population Estimates, 2011
Median Household Income by County, 2005-2009 Source: U.S. Census Bureau, American Community Survey, 5-Year Sample 2005-2009
Percent of population aged 25 years and older with Bachelors degree or higher. 2005-2009 Source: U.S. Census Bureau, American Community Survey, 5-Year Sample 2005-2009
Educational Attainment in Texas, 2011 Source: U.S. Census Bureau, American Community Survey, One-year Sample, 2011.
Race/Ethnic Composition by Education Level in the Labor Force (aged 25 years and more), Texas, 2009 College and Greater Less Than High School Source: Derived from 2009 American Community Survey 1-Year Estimates by the Office of the State Demographer.
Projected Population Growth in Texas, 2010-2050 Source: Texas State Data Center 2012 Population Projections
Projected Population Growth in Panhandle COG Counties, Texas 2010-2050 Source: Texas State Data Center 2012 Population Projections
Projected Population Growth in South Plains COG Counties, Texas 2010-2050 Source: Texas State Data Center 2012 Population Projections
Projected Population Growth in West Central COG Counties, Texas 2010-2050 Source: Texas State Data Center 2012 Population Projections
Projected Population Growth in West Central COG Counties, Texas 2010-2050 Source: Texas State Data Center 2012 Population Projections
Projected Racial and Ethnic Percent, Texas, 2010-2050 Source: Texas State Data Center 2012 Population Projections , 2000-2010 Migration Scenario
Projected Population Change, Texas Counties, 2010-2050 Source: Texas State Data Center 2012 Population Projections . 2000-2010 Migration Scenario
Projected Percent Population Change, Texas Counties, 2010-2050 Source: Texas State Data Center 2012 Population Projections . 2000-2010 Migration Scenario
Teen Birth Rate by State, 2010 Source: National Center for Health Statistics at the Centers for Disease Control and Prevention
Percent households participating in the Supplemental Nutrition Assistance Program (SNAP) by Census Tract Source: U.S. `Census Bureau, American Community Survey, 5-Year Sample, 2007-2011
Projected Increase in Obesity in Texas by Ethnicity, 2006 to 2040 Source: Office of the State Demographer projections, using 2000-2004 migration scenario population projections