Download
1 / 11
110 likes | 117 Views
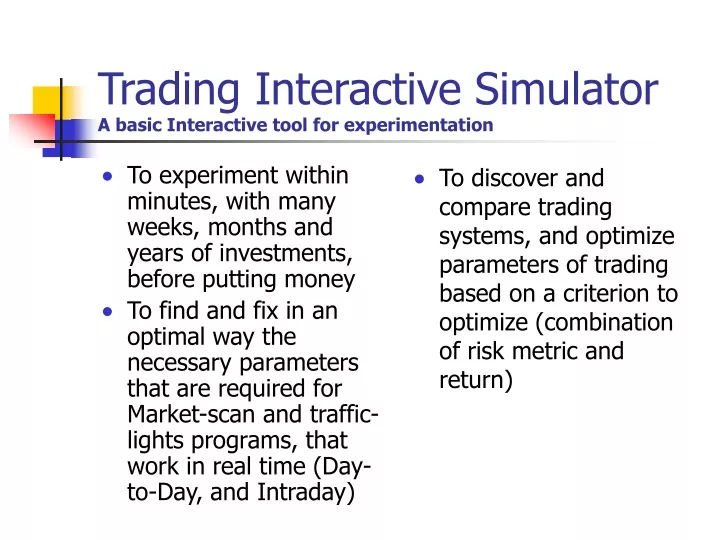
To experiment within minutes, with many weeks, months and years of investments, before putting money To find and fix in an optimal way the necessary parameters that are required for Market-scan and traffic-lights programs, that work in real time (Day-to-Day, and Intraday).

E N D
To experiment within minutes, with many weeks, months and years of investments, before putting money To find and fix in an optimal way the necessary parameters that are required for Market-scan and traffic-lights programs, that work in real time (Day-to-Day, and Intraday) To discover and compare trading systems, and optimize parameters of trading based on a criterion to optimize (combination of risk metric and return) Trading Interactive SimulatorA basic Interactive tool for experimentation
Written in Visual Basic (VBA) Excel Code Size: 45,000 lines,903 pages, 430 procedures. Technical Specifications
To experiment within minutes, with many weeks, months and years of investments, before putting money To learn investing together securities, futures and options, using past historic data (Historic Simulators) To try both automated trading systems, where there is a fixed way to decide about buy, sell or neither in all cases and to try manual intuitive systems of trading without a simple programmable preset system to decide in all cases MAIN OBJECTIVES
To monitor with charts of Back-Office and Front-Office the performance and risk-metrics of the trading system To make a diagnosis about which markets and assets are better for trading To develop manual skills of trading appropriate for specific markets or assets. OTHER OBJECTIVES
Historic data of assets from various markets from a data-base Setup-parameters Outline of Inputs
Choice of automated system Sample size Choice of calibration parameters of automated systems Choice to optimize or not the parameters of the trading system, over an objective of the trading Choice to optimize or not the necessary liquidity in trading Choice to optimize or not a reinvestment system that determines the volumes in the trading Size of steps in the manual historic simulation trading Outline of Setup Parameters
Reads historic or other input data Loads the setup parameters, and trading system Performs step-wise trading (Day-to-Day or Minute-to-Minute) and produces the orders Performs step-wise clearance of the trading Handles, both, fixed (international)and analogue (Greek) margining. Plots charts and histograms of front-office and back-office (after the clearance), of various performance measures and risk metrics Optimizes the trading parameters (like time-scale, filter-sizes, etc) relative to a preset objective of the trading Displays the performance measure over the parameters of trading MAIN FUNCTIONALITIES
Supports historic automated system trading (e.g. user defined Tides or seasonal. Or ripples trading etc) Supports manual interactive simulation trading What it does not supports: It does not supports Virtual trading It does not include a data base to store results or input data It does not supports watch of the market Simulation Functionalities
Risk metrics, histograms and other indicators on the time series of profit at the trading on an asset or portfolio Determination of the decision to buy or Sell or neither based not on the market data but on profit and risk metrics or other indicators of the Back-Office Back-Front Office Risk Management Techniques
Position orientation Red: The asset is open in a Short position Green: The asset is open in a Long position Position state Green: The asset is in an open position White: The assets is a closed position 2-Color BackOffice Position-Code
Input data tables and charts necessary for the manual trading (e.g. forecasting, support-resistance, spectral analysis etc) Step-wise tables of the step-wise clearance (including futures and options margin clearance) with all details (Long, short, transaction prices, profits, average duration of trades, variances etc) Statistical tables, charts and histograms of the clearance results of the trading, with or without reinvestment Liquidity charts, of the reinvestments system, (it handles intermediate bankruptcy) Statistical charts and histograms of the clearance performance over larger steps, than the minimum steps, together with the VaR estimation, and other risk-metrics over this back-office time resolution. Optimizations over back-office resolutions: E.g. find the minimum time period over which the clearance of the trading system gives positive profit with probability more than 95% Outline of Outputs