Download
1 / 20
210 likes | 470 Views
Investment in the Natural Gas Resource Pyramid: Innovation and Efficiency Gains – when new technology requires existing solutions for economic success –the case of shale gas 34 nd IAEE International Conference June 19-22, 2011 Stockholm, Sweden. RESOURCE PYRAMID

E N D
Investment in the Natural Gas Resource Pyramid:Innovation and Efficiency Gains – when new technology requires existing solutions for economic success –the case of shale gas34ndIAEE International ConferenceJune 19-22, 2011Stockholm, Sweden
RESOURCE PYRAMID (Adapted after Holditch 2006, EIA 2011) World – natural gas: tech. recoverable resources: 16000 tcf Shale resources: 6622 tcf Total tech. recoverable resources: 22600 tcf of which proven reserves 6609 tcf Shale Gas PAST: Conventional Reservoirs – Small volumes that are easy to develop 1,000 md PRESENT: Unconventional Reservoirs 10 md Improved technology Increased pricing FUTURE: Large volumes that are difficult to develop 0.1 md 0.001 md Allowed to: access low permeability resource plays Conventional reservoirs can be produced at economic flow Rates and produce economic volumes of oil and gas without massive stimulation treatments, special recovery processes or leading-edge technology. Unconventional reservoirs need Massive stimulation treatments or special recovery processes and technologies. Pyramid is dynamic and may expand and shift in the future – higher quality and smaller quantities resources are at the higher levels of the pyramid - progressively larger volumes of lower quality resources are towards the base of the pyramid. Improved technology and geologic understanding expand the resource pyramid - and can also shift resource from an initial low quality to a higher quality status. Resources status shifts to a reserves status as a resource finally can be extracted technically, legally and economically.
U.S. Natural gas market Phenomenon Shale Gas • Large Scale shale prod. starting in 2005 • => in “Shale gale” from .39 tcf (2000) • 4.87 tcf (2009) • Game Changer (expected high • LNG imports did not materialize) • Gas oversupply due to large • reserves coming online • Diffusion of technology led to • investing in leasing acreage in • Canada and now inotherareas • Gas oversupply due to large • reserves coming online U.S. natural gas data – (EIA April 2011): Total natural gas resource base: 2543 tcf Tech. recoverable shale gas resources: 862 tcf (34% of 2543 tcf) Total natural gas reserves: 288 tcf Shale gas reserves : 60.6 tcf (21% of 288 tcf)
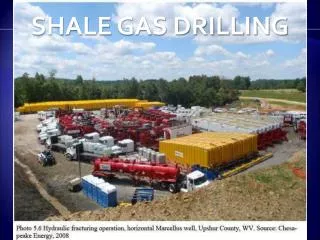
Shale Gas – Components of a 30 year development 2008 First well Eagleford First shale gas completion in Haynesville 2005 First horizontal well drilled in Fayetteville Shale First slickwaterfrac in Fayetteville First well drilled in Marcellus Shale 2004 First well drilled in Fayetteville Shale 2002 First successful horizontal well in Barnett Shale 1997 First slickwaterfrac in Barnett Shale 1992 First horizontal well drilled in Barnett Shale 1981 Barnett Shale discovery well: C.W. Slay #1 1980 Tax credit for unconventional natural gas recovery as part of Crude Oil Windfall Profits Act (“Section 29 credits” of Internal Revenue Code) 1978 Natural Gas Policy Act aimed at phasing out price controls over time Optimization Tech. Develop. regulatory
Decision Diagram in 1980 for Shale gas lease holder Long term business strategy: Take advantage of “Section 29” and Windfall Profits Tax Act, which defined Unconventional natural gas as: “natural gas from shale formations with very low permeability; Natural gas from tight sands – similar to conventional reservoirs, but with lower permeability and porosity ; CBM - Natural gas found in coal seams” Sell Asset Shale Gas Producer Investing in incremental experimentation over time: Between 1981 and 1993 Mitchell drilled 7 wells (@$6-7MM/well) developing concept of “slick water fracturing” of wells, which used friction reducing agents (not thickening gels) that required less proppants than normally used Drill Lease Do Nothing Over next 20 years evolution of “cracking the code” by: Succesfully integrating fracturing & horizontal drilling Developing larger fracture design Performing more rigorous reservoir characterization Reducing drilling cost and stimulation process costs
Changed Situation Framework in 2008 The gas-directed rig count => Improvements led to shorter learning curve for other shale gas developments => Gas oversupply due to large reserves coming online => Gas price decline => Economic recession Optimization Efforts Increased 2008 onwards
Shale • Barnett • Fayetteville • Haynesville • Horn River • Marcellus • Eagleford • “factory drilling” focusing on best wells to maintain production • focus on the concept of a margin business • focus only on core area – operators w/extensive core area acreage • enjoy substantial competitive advantage in terms of $/Mmbtu • as established contiguous area around core has higher value than • value of late non-core entry (due to drill-ready sites, cheaper • drilling via pad-drilling, more efficient logistics) • early entrant with low acreage cost • Superior break-even prices due to proved-up and de-risked sub-surface • favorable hedging situation (tapering off in 2010 – 2011 period) Why do they drill at low gas prices? • Need to drill to fulfill lease requirements to keep license • drilling to delineate sweet spot wells • need to define core area • drill with extensive carry • superior performance of wet section over dry section of Marcellus • value – drivers are NGLs and condensate (de-emphasis of dry gas) • drilling to fulfill lease requirements • drilling to delineate sweet spots and identify core areas
Fayetteville Shale gas improvements (source: Southwestern Energy May 2011) • > Improved data acquisition • & reservoir characterization • Improved completion techniques • Hole stability management • Pad drilling • Supply Chain/logistics improvements • Facility standardization • Optimum well spacing • Refracing of existing wells • Downhole equipment improvements • Increaed number of frac stages Optimization Efforts:
Example of dry gas producer in the Fayetteville Shale, Arkansas Southwestern Energy Costs (2010) Finding and Development Costs: $1.02/Mcfe Cash Operating Costs: $1.30/Mcfe lease operating expenses $0.83/Mcfe General & Admin. Expenses $0.30/Mcfe taxes (other than income taxes) $0.11/Mcfe net interest expense $0.06 Total:$2.32/Mcfe
Shift to higher value oil products Export of Technology Liquefied Natural Gas (oil - indexation) Syngas production followed by F-T process Sell asset Decision Diagram in 2011 for low cost Shale gas lease holder Oil-, condensate, other Liquid- rich formations Global reserves Europe, S. America, China BUT: Regulatory hindrances Infrastructure hindrances Public perception Shale Gas Producer Re-engineering of existing regasification terminals Methanol Ammonia/Urea DME GTL (Diesel, Kerosene. Jet fuel Wax Lube oils Strategic value
LNG Option $/MMBtu Upstream Cost (Fayetteville, AR, U.S.)$2.32 Pipeline Cost to Gulf of Mexico $0.55 Liquefaction Cost ( Cheniere Tolling) $1.75 Shipping to Asia $3.00 D.E.S. at regasification terminal (Total): $7.62 Could deliver < $4.00/ MMBtu
Sales Points Plant Inlet FOB DES • Main opportunities to participate • Deliver gas to plant inlet and sell to aggregator/end purchaser • Deliver ex-ship (DES) and sell to end purchaser, full oil-indexation, price risk, requires LNG capital investment participation, needs to arrange for shipping • Sell to aggregator at plant inlet • Probably result in NYMEX plus uplift for long-term commitment • No oil indexation, no end-market risk, domestic market risk exposure • Sell to end purchaser f.o.b. • Uplift includes long-term supply commitment plus oil indexation for delivery to market • Risks exposure to oil price, shipping and domestic gas price • Shale gas producer approach • Work with marketer to participate to some level in pro-rata share of end-market • Shal e gas producer commits capital to develop reserves and executes long-term commitment for specific level of production • Marketer to arrange shipping and end-purchasers • Pursue opportunities further down value chain Liquefaction Plant LNG Carrier Regas Plant Pipeline
GTL Option Big spread between sales price of oil ($/bbl) and natural gas as feedstock cost e.g. Talisman/SASOL JV to monetize NW Canada shales The higher this ratio i.e. oil prices are high and natural gas prices are low, the more attractive such venture Risk: high oil prices can come down and low gas prices can go up – i.e. ratio declines Upstream Cost $2.32/Mcfe (@ 5.8 MM btu/bbl) = =$13.50/bbl Pipeline Cost $0.00/Mcfe (assuming plant onsite) = $0.00/bbl GTL capex $24 Bn (@140,000 bbl/d – Pearl, Qatar) $6 Bn (@34,000 bbl/d – Escravos, Nigeria) (assuming 20 year lifespan) =$24.00/bbl GTL process costs $0.50/gallon (42 US gallons/bbl) =$21.00/bbl Total Costs=58.50/bbl Note: Shell does not pay for feedgas costs Not included: energy losses - finished product has only 62% of original feedstock energy transportation costs to market Source: World Gas Intelligence February 18, 2009; March 12, 2008, Shell Oil
Sell Asset (if not low cost producer) February 2011: Chesapeake: sold all Fayetteville assets to BHP Billition for US$4.75 Bn net acres 487,000 proved reserves: 2.5 tcfe production: 415 Mmcfe plus sale of 420 miles of pipeline Impact on BHP Billiton: Fayetteville shale becomes a strategic play – i.e. large volume reserve base, long term low cost assets w/significant growth potential for future development > Asset base w/long-term value Impact for Chesapeake: Sales allow to invest in higher margin liquids (crude oil, condensates, NGL) as gas prices are anticipated to remain low ($4-$5/MMBtu long term)
Export of Technology into promising countries But: lack of existing infrastructure e.g. pipelines lack of small service companies e.g. less competition much higher population density i.e. NIMBY much stricter permitting system: e.g. Environmental regulations much less knowledge of geological systems Source: EIA April 2011
Technology Adoption Cycle curve Crossing the Chasm (i.e. shale gas goes Mainstream: >Under the umbrella of high gas prices and the investment strategy of the major oil companies to invest in LNG facilities, independent oil companies could invest in a High cost new technology InnovatorVisionariesPragmatists Mitchell Devon (via farm-in) (via M&A) CNOOC Southwestern Total Chevron KOGAS Chesapeake ENI ExxonMobil Petronas EOG Resources Shell Range Resources Statoil
Market Capitalization of Major Independent Shale Gas Players CompanyMajor ShaleStrategy$Bn Activity(June 11, 2011) Anadarko: Marcellus $36.21 Chesapeake: Marcellus shift to oil $18.56 Range Resources: Marcellus $ 8.32 Devon: Barnett Shale develop $33.64 Southwestern Energy: Fayetteville develop $14.65 Talisman: Horn River Basin GTL $20.36 Marcellus Eagleford liquids EOG Resources: Horn River LNG $28.90 Bn Eagleford liquids Apache: Horn River LNG $45.15 TOTAL MARKET CAP.:$205
Value Creation 2001: Devon pays $3.5 bn for Mitchell Energy @ 20% premium over market value (Mitchell being technicalMarket Leader) 2010: ExxonMobil pays $44 bn for XTO (Market Leader) 2011 (June 11): Market Cap. of eight large independent Companies w/significant shale exposure: $205 bn Options: Drill Sell Do nothing Options: Drill Sell LNG GTL Tech. Export Shift to oil Do nothing 2002 1st successful Horizontal well Barnett Shale (ie. 1st integration of fracingw/ Horizontal drilling - 22 years after “Section 29”) 1997: 1stslickwater Frac in Barnett Shale by Mitchell Energy New large markets accessible due to newtechnology by combining w/ existing technology Commercial value of shale gas in 1980: almost $0 Commercial value of shale gas in 2011: $100s of Billions
Summary Evolutionary process of technology innovation allowed to penetrate the resource pyramid to levels of lower quality resource deposits, resulting in the release of large volumes of shale gas. Efficiency gains in such technology application led to a gas over supply and competitiveness of independent shale gas producers. This forced shale gas producers to focus on rebalancing strategies, such as shifting to liquids production or applying existing gas monetization technologies e.g. by re-engineering existing and under-utilized regasification terminals to be LNG export terminals or by developing GTL facilities. To be successful, shale gas producers have to achieve a low cost structure. Challenges will be the interaction of complexities such as permitting and regulatory issues, policy issues (such as energy security), capitalcosts, financing, sales and purchasing agreements and gas supply agreements and price forecasts.