Download
1 / 34
340 likes | 611 Views
Bayesian Learning and Learning Bayesian Networks. Overview. Full Bayesian Learning MAP learning Maximun Likelihood Learning Learning Bayesian Networks Fully observable With hidden (unobservable) variables. Full Bayesian Learning.

E N D
Overview • Full Bayesian Learning • MAP learning • Maximun Likelihood Learning • Learning Bayesian Networks • Fully observable • With hidden (unobservable) variables
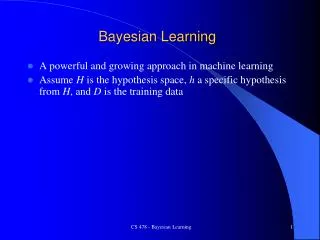
Full Bayesian Learning • In the learning methods we have seen so far, the idea was always to find the best model that could explain some observations • In contrast, full Bayesian learning sees learning as Bayesian updating of a probability distribution over the hypothesis space, given data • H is the hypothesis variable • Possible hypotheses (values of H) h1…, hn • P(H) = prior probability distribution over hypotesis space • jth observation dj gives the outcome of random variable Dj • training data d= d1,..,dk
Full Bayesian Learning • Given the data so far, each hypothesis hihas a posterior probability: • P(hi |d) = αP(d| hi) P(hi) (Bayes theorem) • where P(d| hi) is called the likelihood of the data under each hypothesis • Predictions over a new entity X are a weighted average over the prediction of each hypothesis: • P(X|d) = = ∑iP(X, hi |d) = ∑iP(X| hi,d) P(hi |d) = ∑iP(X| hi) P(hi |d) ~ ∑iP(X| hi) P(d| hi) P(hi) • The weights are given by the data likelihood and prior of each h • No need to pick one best-guess hypothesis! The data does not add anything to a prediction given an hp
Example • Suppose we have 5 types of candy bags • 10% are 100% cherry candies (h100, P(h100 )= 0.1) • 20% are 75% cherry + 25% lime candies (h75 , P(h75 )= 0.2) • 50% are 50% cherry + 50% lime candies (h50 , P(h50 )= 0.4) • 20% are 25% cherry + 75% lime candies (h25 , P(h25 )= 0.2) • 10% are 100% lime candies (h0,P(h100 )= 0.1) • The we observe candies drawn from some bag • Let’s call θ the parameter that defines the fraction of cherry candy in a bag, and hθthe corresponding hypothesis • Which of the five kinds of bag has generated my 10 observations? P(h θ |d). • What flavour will the next candy be? Prediction P(X|d)
Example • If we re-wrap each candy and return it to the bag, our 10 observations are independent and identically distributed, i.i.d, so • P(d| hθ) = ∏j P(dj| hθ) for j=1,..,10 • For a given hθ , the value of P(dj| hθ) is • P(dj = cherry| hθ) = θ; P(dj = lime|hθ) = (1-θ) • And given N observations, of which c are cherry and l = N-c lime • Binomial distribution: probability of # of successes in a sequence of N independent trials with binary outcome, each of which yields success with probability θ. • For instance, after observing 3 lime candies in a row: • P([lime, lime, lime| h 50) = 0.53 because the probability of seeing lime for each observation is 0.5 under this hypotheses
P(h100|d) P(h75|d) P(h50|d) P(h25|d) P(h0|d) Posterior Probability of H P(hi |d) = αP(d| hi) P(hi) • Initially, the hp with higher priors dominate (h50 with prior = 0.4) • As data comes in, the true hypothesis (h0 ) starts dominating, as the probability of seeing this data given the other hypotheses gets increasingly smaller • After seeing three lime candies in a row, the probability that the bag is the all-lime one starts taking off
Prediction Probability ∑iP(next candy is lime| hi) P(hi |d) • The probability that the next candy is lime increases with the probability that the bag is an all-lime one
Overview • Full Bayesian Learning • MAP learning • Maximun Likelihood Learning • Learning Bayesian Networks • Fully observable • With hidden (unobservable) variables
MAP approximation • Full Bayesian learning seems like a very safe bet, but unfortunately it does not work well in practice • Summing over the hypothesis space is often intractable (e.g., 18,446,744,073,709,551,616 Boolean functions of 6 attributes) • Very common approximation: Maximum a posterior (MAP) learning: • Instead of doing prediction by considering all possible hypotheses , as in • P(X|d) = ∑iP(X| hi) P(hi |d) • Make predictions based on hMAP that maximises P(hi |d) • I.e., maximize P(d| hi) P(hi) • P(X|d)~ P(X|hMAP)
P(h100|d) P(h75|d) P(h50|d) P(h25|d) P(h0|d) MAP approximation • Map is a good approximation when P(X |d) ≈ P(X| hMAP) • In our example, hMAPis the all-lime bag after only 3 candies, predicting that the next candy will be lime with p =1 • the bayesian learner gave a prediction of 0.8, safer after seeing only 3 candies
Bias • As more data arrive, MAP and Bayesian prediction become closer, as MAP’s competing hypotheses become less likely • Often easier to find MAP (optimization problem) than deal with a large summation problem • P(H) plays an important role in both MAP and Full Bayesian Learning • Defines the learning bias, i.e. which hypotheses are favoured • Used to define a tradeoff between model complexity and its ability to fit the data • More complex models can explain the data better => higher P(d| hi) danger of overfitting • But they are less likely a priory because there are more of them than simpler models => lower P(hi) • I.e. common learning bias is to penalize complexity
Overview • Full Bayesian Learning • MAP learning • Maximun Likelihood Learning • Learning Bayesian Networks • Fully observable • With hidden (unobservable) variables
Maximum Likelihood (ML)Learning • Further simplification over full Bayesian and MAP learning • Assume uniform priors over the space of hypotheses • MAP learning (maximize P(d| hi) P(hi)) reduces to maximize P(d| hi) • When is ML appropriate?
Maximum Likelihood (ML) Learning • Further simplification over Full Bayesian and MAP learning • Assume uniform prior over the space of hypotheses • MAP learning (maximize P(d| hi) P(hi)) reduces to maximize P(d| hi) • When is ML appropriate? • Used in statistics as the standard (non-bayesian) statistical learning method by those distrust subjective nature of hypotheses priors • When the competing hypotheses are indeed equally likely (e.g. have same complexity) • With very large datasets, for which P(d| hi) tends to overcome the influence of P(hi))
Overview • Full Bayesian Learning • MAP learning • Maximun Likelihood Learning • Learning Bayesian Networks • Fully observable (complete data) • With hidden (unobservable) variables
Learning BNets: Complete Data • We will start by applying ML to the simplest type of BNets learning: • known structure • Data containing observations for all variables • All variables are observable, no missing data • The only thing that we need to learn are the network’s parameters
ML learning: example • Back to the candy example: • New candy manufacturer that does not provide data on the probability of different types of bags, i.e. fraction θof cherry candy • Any θ is possible: continuum of hypotheses hθ • Reasonable to assume that all θ are equally likely (we have no evidence of the contrary): uniform distribution P(hθ) • θ is a parameter for this simple family of models, that we need to learn • Simple network to represent this problem • Flavor represents the event of drawing a cherry vs. lime candy from the bag • P(F=cherry), or P(cherry) for brevity, is equivalent to the fraction θ of cherry candies in the bag • We want to infer θby unwrapping N candies from the bag
ML learning: example (cont’d) • Unwrap N candies, c cherries and l = N-c lime (and return each candy in the bag after observing flavor) • As we saw earlier, this is described by a binomial distribution • P(d| h θ) = ∏j P(dj| h θ) = θc (1- θ) l • With ML we want to find θthat maximizes this expression, or equivalently its log likelihood (L) • L(P(d| h θ) • = log (∏j P(dj| h θ)) • = log (θc (1- θ) l) • = clogθ + l log(1- θ)
ML learning: example (cont’d) • To maximise, we differentiate L(P(d| h θ) with respect to θ and set the result to 0 the proportion of cherries in the bag is equal to the proportion (frequency) of in cherries in the data • Doing the math gives
Frequencies as Priors • So this says that the proportion of cherries in the bag is equal to the proportion (frequency) of in cherries in the data • We have already used frequencies to learn the probabilities of the PoS tagger HMM in the homework • Now we have justified why this approach provides a reasonable estimate of node priors
General ML procedure • Express the likelihood of the data as a function of the parameters to be learned • Take the derivative of the log likelihood with respect of each parameter • Find the parameter value that makes the derivative equal to 0 • The last step can be computationally very expensive in real-world learning tasks
Another example • The manufacturer choses the color of the wrapper probabilistically for each candy based on flavor, following an unknown distribution • If the flavour is cherry, it chooses a red wrapper with probability θ1 • If the flavour is lime, it chooses a red wrapper with probability θ2 • The Bayesian network for this problem includes 3 parameters to be learned • θθ1θ2
Another example (cont’d) • P( W=green, F = cherry| hθθ1θ2) =(*) = P( W=green|F = cherry, hθθ1θ2) P( F = cherry| hθθ1θ2) = θ (1-θ1) • We unwrap N candies • c are cherry and l are lime • rc cherry with red wrapper, gc cherry with green wrapper • rllime with red wrapper, g llime with green wrapper • every trial is a combination of wrapper and candy flavor similar to event (*) above, so • P(d| hθθ1θ2) = ∏j P(dj| hθθ1θ2) • = θc(1-θ) l (θ1) rc(1-θ1) gc(θ2) r l (1-θ2) g l
Another example (cont’d) • I want to maximize the log of this expression • clogθ + l log(1- θ) + rclog θ1 + gclog(1- θ1) + rllog θ2 + g llog(1- θ2) • Take derivative with respect of each of θ, θ1 ,θ2 • The terms not containing the derivation variable disappear
ML parameter learning in Bayes nets • Frequencies again! • This process generalizes to every fully observable Bnet. • With complete data and ML approach: • Parameters learning decomposes into a separate learning problem for each parameter (CPT), because of the log likelihood step • Each parameter is given by the frequency of the desired child value given the relevant parents values
Very Popular Application C • Naïve Bayes models: very simple Bayesian networks for classification • Class variable (to be predicted) is the root node • Attribute variables Xi (observations) are the leaves • Naïve because it assumes that the attributes are conditionally independent of each other given the class • Deterministic prediction can be obtained by picking the most likely class • Scales up really well: with nboolean attributes we just need……. Xi X1 X2
Very Popular Application C • Naïve Bayes models: very simple Bayesian networks for classification • Class variable (to be predicted) is the root node • Attribute variables Xi (observations) are the leaves • Naïve because it assumes that the attributes are conditionally independent of each other given the class • Deterministic prediction can be obtained by picking the most likely class • Scales up really well: with nboolean attributes we just need 2n+1 parameters Xi X1 X2
Example • Naïve Classifier for the newsgroup reading example
Example • Naïve Classifier for the newsgroup reading example
Problem with ML parameter learning • With small datasets, some of the frequencies may be 0 just because we have not observed the relevant data • Generates very strong incorrect predictions: • Common fix: initialize the count of every relevant event to 1 before counting the observations
Probability from Experts • As we mentioned in previous lectures, an alternative to learning probabilities from data is to get them from experts • Problems • Experts may be reluctant to commit to specific probabilities that cannot be refined • How to represent the confidence in a given estimate • Getting the experts and their time in the first place • One promising approach is to leverage both sources when they are available • Get initial estimates from experts • Refine them with data
Combining Experts and Data • Get the expert to express her belief on event A as the pair • <n,m> • i.e. how many observations of A they have seen (or expect to see) in m trials • Combine the pair with actual data • If A is observed, increment both n and m • If ⌐A is observed, increment m alone • The absolute values in the pair can be used to express the expert’s level of confidence in her estimate • Small values (e.g., <2,3>) represent low confidence • The larger the values, the higher the confidence WHY?
Combining Experts and Data • Get the expert to express her belief on event A as the pair • <n,m> • i.e. how many observations of A they have seen (or expect to see) in m trials • Combine the pair with actual data • If A is observed, increment both n and m • If ⌐A is observed, increment m alone • The absolute values in the pair can be used to express the expert’s level of confidence in her estimate • Small values (e.g., <2,3>) represent low confidence, as they are quickly dominated by data • The larger the values, the higher the confidence as it takes more and more data to dominate the initial estimate (e.g. <2000, 3000>)