Download
1 / 14
140 likes | 259 Views
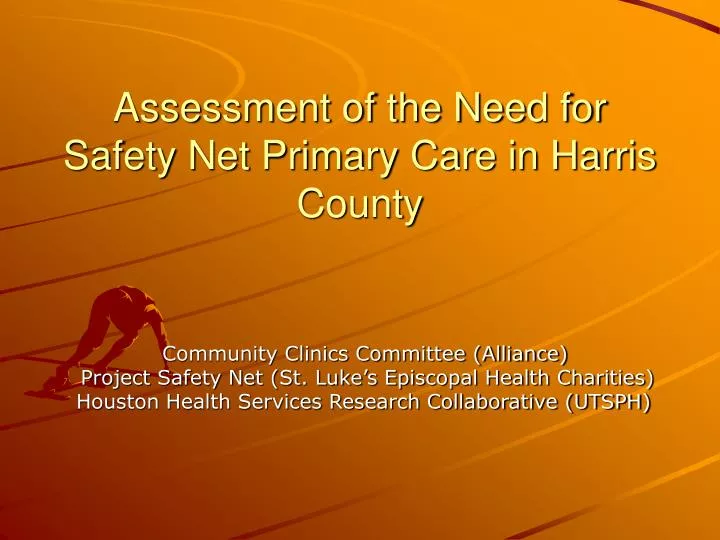
Assessment of the Need for Safety Net Primary Care in Harris County. Community Clinics Committee (Alliance) Project Safety Net (St. Luke’s Episcopal Health Charities) Houston Health Services Research Collaborative (UTSPH). Objectives.

E N D
Assessment of the Need for Safety Net Primary Care in Harris County Community Clinics Committee (Alliance) Project Safety Net (St. Luke’s Episcopal Health Charities) Houston Health Services Research Collaborative (UTSPH)
Objectives • Obtain and analyze meaningful data to prioritize areas of the County in greatest need for safety net primary care. • Use data from the ED Algorithm Study to identify the Northeast quadrant. • Use uninsurance data, primary care use data, and Project Safety Net to determine demand/supply gap for primary care.
2004 ED Algorithm Report • 54.5% of ED visits primary care sensitive • 37.8% of PCS ED visits by uninsured • Is it a lack of primary care resources? • Are people not aware of safety-net providers or do they need more help deciding when to seek care or how to manage illnesses? • Are the providers in the area performing suboptimally? • Community Clinics Committee – focus on primary care capacity
Method for Assessing Demand • Latest estimates of the low-income uninsured at the ZIP code-level • Multiplied by the latest annual number of primary care visits to HCHD clinics: 2.1 • Summed for each quadrant
Estimated Supply • Project Safety Net clinics • Provide free and/or discounted primary care and serve as a medical home • Services available at least 20 hours per week • 2005 primary care visits • Seen by physician or mid-level practitioner • Does not include immunizations or medication refills • Provided to the uninsured • Does not include visits of patients with public or private coverage
Limitations • Supply overestimates capacity since patients may use clinics outside their quadrant • Supply for the uninsured is based on unproven assumptions about payer mix • Unmet demand of the uninsured underestimates clinic visits needed since clinics cannot survive if only serving the uninsured • Supply underestimates capacity since it does not include charity care of private physicians
Next Steps • Mid-October meeting of safety net providers in Northeast quadrant • Explore existing and potential expansion plans • Develop mechanisms for soliciting support for additional capacity from health systems, public agencies, legislative bodies, and others • Refine PSN data request from providers