Download
1 / 53
530 likes | 534 Views
This presentation reviews tie benefits assumptions for the upcoming annual reconfiguration auctions (ARAs) in New England, including total tie benefits and contributions from individual interconnections. The methodology and calculations are outlined, highlighting the adjustments made for imports and capacity imports.

E N D
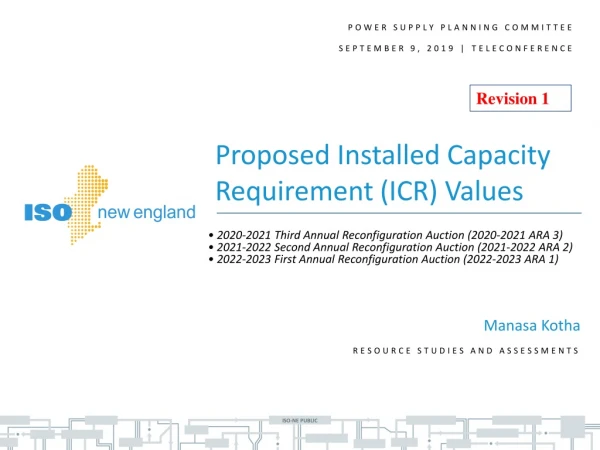
NEPOOL Power SUPPLY PLANNING Committee August 29, 2019 | Westborough, MA Quan Chen, Peter Wong and Fei Zeng Resource Studies and Assessments 2020-2021 Third Annual Reconfiguration Auction (2020-2021 ARA 3) 2021-2022 Second Annual Reconfiguration Auction (2021-2022 ARA 2) 2022-2023 First Annual Reconfiguration Auction (2022-2023 ARA 1) Proposed Tie Benefits Assumptions for Annual Reconfiguration Auctions (ARAs) to be Conducted in 2020 Revision 1
Objective • To review the tie benefits assumptions to be used in the calculation of ICR-Related Values* for 2020-2021 ARA 3, 2021-2022 ARA 2 and 2022-2023 ARA 1consisting of: • Total tie benefits for New England • Tie benefits contribution from individual or group of interconnection(s) • Maritimes (New Brunswick) • HQ Phase II • Highgate • New York AC ties • Cross Sound Cable Note: Please see Appendix IV for the acronyms used in this presentation *The ICR, net ICR, LRA, TSA, LSR, MCL, MRI Demand Curves and the HQICCs are collectively referred to as the ICR-Related Values.
Background Pursuant to Section III.12.9 of the Tariff, tie benefits are calculated for the FCA and the third ARA of the CCP of interest. For the first and second ARA of the CCP of interest, the tie benefits for the FCA of the CCP shall be used; however, these tie benefits shall reflect any changes to the import capability of an interconnection or group of interconnections with a neighboring Control Area in the adjustment to tie benefits to account for capacity imports under Section III.12.9.6.1 of the Tariff.
Summary of Tie Benefits Assumptions for 2020-2021 ARA 3, 2021-2022 ARA 2 and 2022-2023 ARA 3 Revised *These are the results of the August 2019 Tie Benefits Study conducted for ARA 3 for the CCP 2020-2021 to be reviewed today ** These are the results of the tie benefits study conducted for the 2021-2022 CCP FCA 12. The details of the study are available at: https://www.iso-ne.com/static-assets/documents/2017/06/pspc_6_22_2017_tie_benefits_study.pdf ***These are the results of the tie benefits study conducted for the 2022-2023 CCP FCA 13. The details of the study are available at: https://www.iso-ne.com/static-assets/documents/2018/07/a41_pspc_propsd_tiebenfits_fca13_07262018.pdf
To calculate tie benefits values from neighboring Control Areas to New England for ARA 3 for the 2020-2021 CCP through a probabilistic analysis, according to the methodology described in Section III.12.9 of Market Rule 1 The calculations include: Total tie benefits from all neighboring Control Areas (i.e., Quebec, Maritimes (New Brunswick) and New York) Tie benefits associated with each neighboring Control Area Tie benefits associated with an individual interconnection or a group of interconnections of interest Scope of Study
Process 1.0 Calculate the tie benefits values for all possible interconnection states using isolated New England system as the reference Process 2.0 Calculate initial total tie benefits for New England from all neighboring Control Areas Process 3.0 Calculate initial tie benefits for each individual neighboring control area Pro-rate tie benefits values of individual Control Areas based on the total tie benefits, if necessary Process 4.0 Calculate initial tie benefits for individual interconnection or group of interconnections Pro-rate tie benefits values of individual interconnection or group of interconnections based on the individual Control Area tie benefits, if necessary Process 5.0 Adjust tie benefits of individual interconnection or group of interconnections to account for capacity imports Process 6.0 Calculate the final tie benefits for each individual neighboring Control Area Process 7.0 Calculate the final total tie benefits for New England Recap of Calculation Process
Process 1.0Calculation of Tie Benefits for All Interconnection States X – disconnected √ - connected
Compare state 1 (without any ties) and state 2 (with all the ties) Total tie benefits = 1,945 MW This value is subject to the adjustment later to account for imports Process 2.0Calculation of Initial Total Tie Benefits
All interconnections connected to a given neighboring Control Area are grouped together to represent the state of interconnection between New England and that neighboring Control Area. The simple average of values for all the interconnection states represents the tie benefits of the target neighboring Control Area (four states for each area) Tie benefits from Maritimes 1 vs. 32 = 635 2 vs. 3 = 465 12 vs. 18 = 320 17 vs. 23 = 505 Average = 490 MW Tie benefits from Quebec 1 vs. 23 = 1,270 2 vs. 12 = 950 3 vs. 18 = 825 17 vs. 32 = 1,155 Average = 1,050 MW Tie benefits from New York 1 vs. 18 = 655 2 vs. 17 = 155 3 vs. 23 = 210 12 vs. 32 = 360 Average = 345 MW Tie benefits after proration (since 490 + 1,050 + 345 =1,885≠ 1,945) Maritimes initial tie benefits = 1,945 * 490 / (490 + 1,050 + 345) = 1,945 * 0.2599 = 506 MW Hydro Quebec initial tie benefits = 1,945 * 1,050 / (490 + 1,050 + 345) = 1,945 * 0.5570 = 1,083 MW NY initial tie benefits = 1,945 * 345 / (490 + 1,050 + 345) = 1,945 * 0.1830 = 356 MW Process 3.0 Calculation of Tie Benefits for Neighboring Control Areas
Each individual interconnection or group of interconnections subject tothe individual tie benefits contribution calculation is treated independently. The simple average of values for all the interconnection states represents tie benefits of the target interconnection or group of interconnections Interconnections with Maritimes (New Brunswick) No individual interconnections subject to the calculation Interconnections with Quebec HQ Phase II and Highgate are subject to the calculation HQ Phase II 1 vs. 31 = 1,130 2 vs. 4 = 835 3 vs. 8 = 725 5 vs. 12 = 815 9 vs. 18 = 715 17 vs. 26 = 995 23 vs. 30 = 1,070 27 vs. 32 = 1,005 Average = 911.25 MW Highgate 1 vs. 30 = 200 2 vs. 5 = 135 3 vs. 9 = 110 4 vs. 12 = 115 8 vs. 18 = 100 17 vs. 27 = 150 23 vs. 31 = 140 26 vs. 32 = 160 Average = 138.75 MW Tie benefits after proration (since 911 + 139 = 1,050 ≠ 1,083) TB_Ph-II_initial = 1,083 * 911 / (911 + 139) = 1,083 * 0.8779 = 940 MW TB_HG_initial = 1,083 * 139 / (911 + 139) = 1,083 * 0.1321 = 143 MW Process 4.0Calculation of Tie Benefits for Individual or Group of Interconnections
Interconnections with New York NY AC ties and CSC are subject to the calculation NY AC ties 1 vs. 29 = 655 2 vs. 6 = 155 3 vs. 10 = 210 7 vs. 17 = 155 11 vs. 23 = 210 12 vs. 24 = 360 18 vs. 28 = 655 25 vs. 32 = 360 Average = 345 MW CSC 1 vs. 28 = 0 2 vs. 7 = 0 3 vs. 11 = 0 6 vs. 17 = 0 10 vs. 23 = 0 12 vs. 25 = 0 18 vs. 29 = 0 24 vs. 32 = 0 Average = 0 MW Tie benefits after proration (since 345 + 0 = 345 ≠ 356 ) NY AC initial tie benefits = 356 * 345 / (345 + 0) = 356 * 1.0 = 356 MW CSC initial tie benefits = 356 * 0 / (345 + 0) = 356 * 0 = 0 MW Process 4.0 (cont.)
Tie benefits determined in Process 4.0 for individual interconnection or group of interconnections are adjusted to account for capacity imports Interconnections with Maritimes (New Brunswick) Imports with CSOs = 200 MW Assumed interface import capability = 700 MW Remaining import capability after accounting for import CSOs = 700 – 200 = 500 MW Tie benefits value calculated in Process 4.0 = 506 MW Since 506 MW > 500 MW, the tie benefit is limited by the remaining import capability TB_MT = 500 MW Interconnections with Quebec HQ Phase II Imports with CSOs = 441 MW Assumed interface import capability = 1,400 MW Remaining import capability after accounting for import CSOs = 1,400 – 441 = 959 MW Tie benefits value calculated in Process 4.0 = 940 MW Since 940 MW < 959 MW, no adjustment is required TB_PH-II = 940 MW Process 5.0Adjustment to Initial Tie Benefits Values
Interconnections with Quebec Highgate Imports with CSOs = 55 MW Assumed interface import capability = 200 MW Remaining import capability after accounting for import CSOs = 200 – 55 = 145 MW Tie benefits value calculated in Process 4.0 = 143 MW Since 143 MW < 145 MW, no adjustment is required TB_HG = 143 MW Interconnections with New York NY AC Ties Existing import = 926 MW Assumed total import capability = 1,400 MW Remaining import capability after import = 1,400 – 926 = 474 MW Tie benefits value calculated in Process 4.0 = 356 MW Since 356 < 474 MW, no adjustment is required NY ACT tie benefits = 474 MW CSC No adjustments required since there are no tie benefits CSC tie benefits = 0 MW Process 5.0Adjustment to Initial Tie Benefits Values (cont.)
Final tie benefits for each neighboring Control Area are the sum of the tie benefits from the individual interconnections or groups of interconnections with that Control Area, after accounting for the adjustments for capacity imports as determined in Process 5.0 Maritimes (New Brunswick) = 500 MW Quebec = 940 + 143 = 1,083 MW New York = 356 + 0 = 356 MW Process 6.0Determination of Tie Benefits for Individual Neighboring Control Area
Final tie benefits for each neighboring Control Area are the sum of the tie benefits from the individual interconnections or groups of interconnections with that Control Area after accounting for the adjustments for capacity imports as determined in Process 5.0 Total tie benefits = 500 + 1083 + 356 = 1,939 MW Process 7.0Determination of Total Tie Benefits for New England
Total tie benefits = 1,939 MW, with the following contributions: Maritimes (New Brunswick) ties = 500 MW HQ Phase II = 940 MW Highgate = 143 MW NY AC ties = 356 MW Cross Sound Cable = 0 MW Summary of Tie Benefits Study Resultsfor 2020-2021 ARA 3
Comparison of Tie Benefits for 2020-2021 ARA 3 and FCA 11 (MW) • *Details of the tie benefits study for the 2020-2021 CCP (FCA 11) are available at:https://www.iso-ne.com/static-assets/documents/2016/09/a3_fca11_tie_benefits_study_results.pptx
The initial (prior to capacity import adjustments) total tie benefits are 1,945 MW, which are 5 MW lower than the tie benefits (1,950 MW) assumed for FCA 11 The final (after capacity import adjustments) total tie benefits of 1,939 MW are 11 MW lower than the values assumed for FCA 11 Maritimes (New Brunswick) tie benefits remained the same Quebec tie benefits decreased by 19 MW Highgate tie benefits decreased by 2 MW NY tie benefits increased by 10 MW Several assumption and modeling changes have taken place in this ARA3 study as compared to the FCA 11 study Increasing the minimum Operating Reserve assumption from 200 MW to 700 MW Estimated impact of decreasing tie benefits by 60 MW The change of 5% voltage reduction load relief from 1.5% to 1.0% Estimated impact of decreasing tie benefits by 20 MW https://www.iso-ne.com/static-assets/documents/2018/09/a2_pspc_impacts_icr_assmptns_07262018.pdf BTM-PV is modeled on an hourly basis Estimated impact of increasing tie benefits by 67 MW based on the observation of the FCA 12 tie benefit study https://www.iso-ne.com/static-assets/documents/2017/06/pspc_6_22_2017_tie_benefits_study.pdf Observations 19
Appendix I Tie Benefits Study for 2020-2021 ARA 3 – Methodology
Process 1.0 Calculate the tie benefits values for all possible interconnection states using isolated New England system as the reference Process 2.0 Calculate initial total tie benefits for New England from all neighboring Control Areas Process 3.0 Calculate initial tie benefits for each individual neighboring Control Area Pro-rate tie benefits values of individual Control Areas based on the total tie benefits, if necessary Process 4.0 Calculate initial tie benefits for individual interconnection or group of interconnections Pro-rate tie benefits values of individual interconnection or group of interconnections based on the individual Control Area tie benefits, if necessary Process 5.0 Adjust tie benefits of individual interconnection or group of interconnections to account for capacity imports Process 6.0 Calculate the final tie benefits for each individual neighboring Control Area Process 7.0 Calculate the final total tie benefits for New England Study Methodology - SummaryCalculation Process
Calculation of tie benefits values for all possible interconnection states Bring all interconnected areas to LOLE of 0.1 days/year simultaneously Calculate New England’s LOLE for all the possible interconnection states, e.g. with no interconnections (isolated state) With any single interconnection only With any of two interconnections With any of three interconnections … Calculate the equivalent tie benefits values for each interconnection state using the isolated state as reference As the equivalent MW to bridge the LOLE delta between these two states Study MethodologyCalculation Process 1.0
Calculation of total tie benefits for New England Compare the following two interconnection states New England system with all interconnections to neighboring Control Areas connected New England System with all interconnections with neighboring Control Areas disconnected Total tie benefits for New England is the equivalent MW value to bridge the LOLE delta between these two states This initial total tie benefits value is subject to adjustment to account for capacity imports in a later process Study MethodologyCalculation Process 2.0
Calculation of initial tie benefits for each individual neighboring Control Area all interconnections connected to a given neighboring Control Area are grouped together to represent the state of interconnection between New England and that neighboring Control Area For each target neighboring Control Area, identify all the related interconnection states and calculate the equivalent tie benefits values for each of these states With a total of three neighboring control areas, there are four interconnection states for each neighboring area Use the simple average of values for all the interconnection states to represent the tie benefits of the target neighboring Control Area If the sum of the individual control area tie benefits calculated above is different than the total tie benefits calculated in Process 2.0, each Control Area’s tie benefits shall be adjusted based on the ratio of the individual Control Area tie benefits to the total tie benefits These initial individual Control Area tie benefits are subject to further adjustment to account for capacity imports in a later process. Study MethodologyCalculation Process 3.0
Adjustment to the initial tie benefits for individual interconnection or group of interconnections Deduct capacity imports from the import capability of each individual interconnection or group of interconnections to determine the remaining available import capability to support tie benefits Capacity imports are the Qualified Existing Import Capacity for FCA 2022-2023 Compare the tie benefits value of an individual interconnection or group of interconnections as determined in Process 4.0 to its remaining transmission import capability If the tie benefits value is greater than the remaining transmission import capability, the tie benefit value of the individual interconnection or group of interconnections is capped to the remaining transmission import capability Otherwise, no adjustments are made Study MethodologyCalculation Process 5.0
Determination of tie benefits for individual neighboring Control Areas Final tie benefits for each neighboring Control Area are the sum of the tie benefits from the individual interconnections or groups of interconnections with that Control Area, after accounting for any adjustment for capacity imports as determined in Process 5.0 Study MethodologyCalculation Process 6.0
Determination of total tie benefits for New England Final total tie benefits from all neighboring control areas are the sum of the Control Area tie benefits after accounting for any adjustment for capacity imports as determined in Process 6.0 Study MethodologyCalculation Process 7.0
Appendix II Tie Benefits Study for 2020-2021 ARA 3 – Assumptions
The GE MARS model* is used to simulate New England and its directly interconnected neighboring Control Areas (i.e., Quebec, Maritimes (New Brunswick), and New York) An equivalent model is used to reflect the impacts of the known capacity imports/exports between New England’s directly interconnected neighboring Control Areas and their respective neighboring Control Areas (i.e., PJM and Ontario) * MARS is a “pipe-and-bubble” transportation model Simulation Model
Quebec, Maritimes, New England, and New York are simulated using a subarea transportation model An equivalent model is used to reflect the impacts of the known capacity import/export between New England’s directly interconnected neighboring Control Areas and their respective neighboring Control Areas (i.e., PJM and Ontario) Control Areas Modeling
New England Load Forecast Based on the 2019 Forecast Report of Capacity, Energy, Loads and Transmission Report load data BTM PV forecast is modeled with an hourly profile The performance uncertainty of BTM PV is modeled using a 7-day uncertainty window Load Shape 2002 hourly shape; consistent with current NPCC studies Neighboring Control Areas Load Forecast Based on their latest load models used in NPCC studies for the year 2020 2002 hourly shape; consistent with current NPCC studies Load Assumptions
New England Area All qualified existing capacity resources are modeled Assumptions for resource ratings, EFORd & maintenance weeks consistent with assumptions for the 2020-2021 ARA 3 ICR calculations Import resources Import resources are modeled at the value of their CSO as of June 2020 (see slide 16 for detailed values) Neighboring Control Areas Modeled resources based on 2018 NPCC Long Range Adequacy Overview & 2019 NPCC Summer Assessment Quebec Maritimes New York - 2019 New York Gold Book Ontario & PJM (for the purpose of modeling the impacts of capacity imports/exports with Quebec and New York) Resource Assumptions
Transmission interfaces and transfer capabilities New England RSP subarea representation Transfer capabilities consistent with the transmission transfer capabilitiespresentation reviewed at the March 2019 NEPOOL RC meeting* Interfaces associated with 2020-2021 Capacity Zones are not modeled Export-constrained Capacity Zone of NNE (includes Maine, New Hampshire and Vermont Load Zones) Import-constrained Capacity Zone of SENE (includes the NEMA/Boston and SEMA/RI Load Zones) Neighboring Control Areas Consistent with their latest model used in NPCC studies *Based on transmission transfer capability limits presented at the March 20, 2019 Reliability Committee meeting. The presentation is available at: https://www.iso-ne.com/static-assets/documents/2019/03/a7_fca_14_transmission_transfer_capabilities_and_capacity_zone_development.pdf Transmission System Representation
Internal Interface Transfer Capability (MW) Notes a) through f) are discussed in slides 9 and 10 of this presentation. The purple color highlights transfer capability changes that start in 2019. The orange color highlights transfer capability changes that start later.
Internal Interface Transfer Capability (Notes) a) Limits are for the summer period, except where noted to be winter • The limits may not include possible simultaneous impacts, and should not be considered as “firm” • For the years within the FCM horizon (CCP 2023-2024 and sooner), only accepted certified transmission projects are included when identifying transfer limits • For the years beyond the FCM horizon (CCP 2024-2025 and later), transmission upgrades with an approved proposed plan are included according to their expected in-service dates
Internal Interface Transfer Capability (Notes)(cont.) b) Increase associated with the Greater Boston upgrades, without the Wakefield – Woburn 345 kV line (CCPs 2019-2020 and 2020-2021) c) Increase associated with the Greater Boston upgrades, with the Wakefield – Woburn 345 kV line in service (CCP 2021-2022 and later) d) Increase associated with the Greater Hartford/Central Connecticut upgrades e) Increase associated with the Southwest Connecticut upgrades f) Increase associated with the SEMA/RI Reliability project upgrades
External Interface Import Capability (MW) Notes 1) through 6) are discussed in slides 12 and 13 of this presentation.
External Interface Import Capability(Notes) • Limits are for the summer period • The limits may not include possible simultaneous impacts, and should not be considered as “firm” (the bases for these limits are subject to more detailed review in the future) • The electrical limit of the New Brunswick-New England (NB-NE) tie is 1,000 MW • When adjusted for the ability to deliver capacity to the greater New England Control area, the NB-NE transfer capability is 700 MW • This is because of downstream constraints; in particular Orrington South • The capability for the Highgate facility is listed at the New England AC side of the Highgate terminal
External Interface Import Capability (Notes) (cont.) • The Hydro-Quebec Phase II interconnection is a DC tie with equipment ratings of 2,000 MW. Due to the need to protect for the loss of this line at full import level in the PJM and NY Control Areas, ISO-NE has assumed its transfer capability for capacity and reliability calculation purposes to be 1,400 MW • This assumption is based on the results of loss-of-source analyses conducted by PJM and NY • Import capability on the Cross Sound Cable is dependent on the level of local generation • New York interface limits • These are without Cross Sound Cable and with the Northport Norwalk Cable at 0 MW flow • Simultaneously importing into NE and SWCT or CT can lower the NY-NE capability (very rough decrease = 200 MW)
New England Internal transmission interfaces are modeled 100 % available because the power can be delivered using multiple paths External availability assumptions are based on results of a study conducted in 2019* Please note that the MARS program only allows modeling the forced outage rate. It is assumed that maintenance needs will have minimum reliability impact because they are scheduled during periods when the system is reliable Neighboring Control Areas Consistent with their latest model used in NPCC studies *Based on the results of a study on external tie lines availability presented at the May 30, 2019 Power Supply Planning Committee meeting. The presentation is available at: https://www.iso-ne.com/static-assets/documents/2019/05/a5_tie_line_availability_05302019.pdf Transmission Interfaces Availability Assumptions
New England Assume 2,305 MW of system-wide operating reserves Allowed to deplete to a minimum of 700 MW as OP-4 actions progress prior to firm load shedding Local reserve requirements are based on the latest Forward Reserve Market auction requirements CT: 0 MW (summer); 0 MW (winter) SWCT: 0 MW (summer); 0 MW (winter) BOSTON: 0 MW (summer); 0 MW (winter) Voltage reductions Consistent with the ICR calculation, and the amount for subareas calculated as (90/10 subarea net peak load* MW minus all Active Demand Capacity Resources and Passive Demand Resources) x 1.0% Neighboring Control Areas Consistent with their latest model in NPCC studies *Net peak load is the gross load minus the load reduction associated with BTM PV Other AssumptionsOperating Reserves and Relief from Voltage Reduction
Import CSOs* Used for Tie Benefits Adjustments *CSOs as of June, 2020
Appendix III Tie Benefits Study for 2020-2021 ARA 3 - System Diagrams for Information Purposes
J3 J4 J3 K2 Interconnected System Representation for 2020 (MW) Quebec 5,200 Maritimes 2,250 15,050 300 12,900 900 S 1,000 W 300 NM NS PEI NB Que Cent. Chur. Mtl ND JB MAN 1,200 S 0 W 575 S 575 W 150 9,999 350 2,138 550 22,290 100 1,000 100 199 700 1 1,500 BHE 190 S 198 W Cedars New York 1,400 D 200 A 0 0 CMA VT G 600 C 425 F 800 0 RECO 300 150 600 J 140 660 800 W-MA 200 0 815 1,045 9999 315 1,000 0 K 330 800 CT 0 315 414 2,000 660 0 200 300 0 New England 660 0 NOR 0 385 315 Equivalent for PJM-NY boundary 660 1,400 660 1,400 Total NY-NE (Excludes CSC)
AG CPVVEC RECO HTP 9,999 2,000 PJM to G&J VFT LI Sum 29 –282 * J3 1,528 LI West 99,999 18 New York System Representation for 2020 (MW) To Cedars 0 To Quebec To VT 1,000 D 800 1,500 800 2,770 - 3,100* F CE Group 0 To WMA 4,510-5,000* 3,400 1,600 1,999 UPNY-SENY 2,650 1,999 3,475 1,999 2,300 5,500 9,999 1,999 9,999 1,500 A B C E 800 1,600 2,275 2,275 600 G To CT 1,600 5,650 9,999 Total East 1,999 0 9,999 9,999 900 2,750 1000 5,750 425 140 1,000 150 H 500 1,999 1045 9999 8,450 1,000 Equivalent for PJM-NY boundary DSY49Y50 I 0 PJM to G 1,000 9999 385 660 1,999 J2 1,999 To CT 5,600 342 0 0 315 0 9999 500 0 0 K1 0 600 330 1,293 315 4,400 315 330 CSC 815 330 K J 660 414 235- 505 * 235 0 To NOR 660 0 K2 660 *Rating is a function of unit availabilities and/or area loads
BHE ME VT WMA CT SME NH SEMA RI NOR New England System Representation for2020 (MW) To NB East – West 3,500/2,200 550 To Quebec To Quebec Highgate 100 NB - NE 1,200 S 0 W ME - NH 200 Surowiec South Orrington South 0 Phase II 700 0 To D 1,900 1,325 1,500 Total NY-NE (Excludes CSC) North – South 2,725 (relaxed) Southeast Import 5,400 (relaxed) 1,400 1,400 1,400 Boston Import 5,400 To F Boston 800 800 CMA/ NEMA To G 600 To K 800 330 (CSC) 0 Connecticut (Excludes CSC) 3,400 Norwalk - Stamford 9,999 In SEMA/RI Export/Import 3,400/1,280 SWCT 414 Southwest CT Import 2,500 0 *Rating is a function of unit availabilities and/or area loads To K
Maritimes NB 'NEW BRUNSWICK' NS 'NOVA SCOTIA' PEI 'PRINCE EDWARD ISLAND' NM 'NORTHERN MAINE ISA' Quebec JB 'JAMES BAY' Chur 'CHURCHILL' MAN 'NORTH COAST/MANIC' Que Cent. 'CENTRE (Que.)' Mtl 'SOUTHWEST/MTL' ND 'NICOLET-DESCANTONS' CEDARS ' for cedar sale' Abbreviations of Subareas in Diagram • New York • A 'AREA_A, West' • B 'AREA_B, Genesee' • C 'AREA_C, Central' • D 'AREA_D, North' • E 'AREA_E, Mohawk Valley ' • F 'AREA_F, Capital' • G 'AREA_G, Hudson Valley' • CPVVEC 'AREA FOR CPV VEC' • H 'AREA_H, Millwood ' • I 'AREA_I, Downwoode' • J 'AREA_J, New York City ' • J3 ‘Staten Island’ • HTP (J4) 'HTP CABLE' • VFT (J5 ) 'LINDEN VFT CABLE-' • K 'AREA_K, Long Island' • RECO 'RECO PJM' K1 ‘CSC cable” K2 ‘Contracts over Neptune cable”
Abbreviations of Subareas in Diagram, cont. • New England • BHE ‘Northeastern Maine’ • ME ‘Western and central Maine and Saco Valley, New Hampshire’ • SME ‘Southeastern Maine’ • NH ‘Northern, eastern, and central New Hampshire; eastern Vermont; and southwestern Maine’ • VT ‘Vermont and southwestern New Hampshire’ • Boston ‘Greater Boston, including the North Shore’ • CMA/NEMA ‘Central Massachusetts and northeastern Massachusetts’ • WMA ‘Western Massachusetts’ • SEMA ‘Southeastern Massachusetts and Newport, Rhode Island’ • RI ‘Part of Rhode Island bordering Massachusetts’ • CT ‘Northern and eastern Connecticut’ • SWCT ‘Southwestern Connecticut’ • NOR ‘Norwalk and Stamford, Connecticut’
Appendix IV Acronyms