Download
1 / 11
110 likes | 259 Views
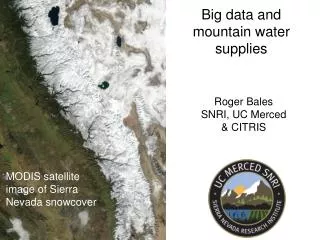
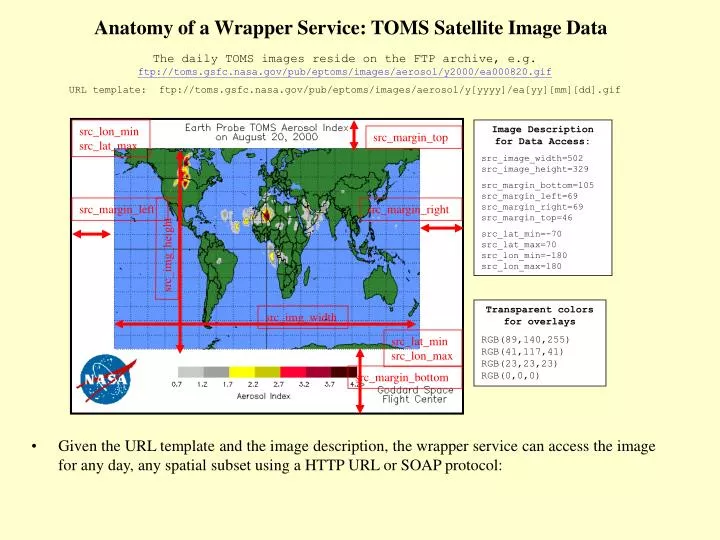
Anatomy of a Wrapper Service: TOMS Satellite Image Data. The daily TOMS images reside on the FTP archive, e.g. ftp://toms.gsfc.nasa.gov/pub/eptoms/images/aerosol/y2000/ea000820.gif URL template: ftp://toms.gsfc.nasa.gov/pub/eptoms/images/aerosol/y[yyyy]/ea[yy][mm][dd].gif.

E N D
Anatomy of a Wrapper Service: TOMS Satellite Image Data The daily TOMS images reside on the FTP archive, e.g. ftp://toms.gsfc.nasa.gov/pub/eptoms/images/aerosol/y2000/ea000820.gif URL template: ftp://toms.gsfc.nasa.gov/pub/eptoms/images/aerosol/y[yyyy]/ea[yy][mm][dd].gif src_lon_min src_lat_max Image Description for Data Access: src_image_width=502 src_image_height=329 src_margin_bottom=105 src_margin_left=69 src_margin_right=69 src_margin_top=46 src_lat_min=-70 src_lat_max=70 src_lon_min=-180 src_lon_max=180 src_margin_top • Given the URL template and the image description, the wrapper service can access the image for any day, any spatial subset using a HTTP URL or SOAP protocol: src_margin_left src_margin_right src_img_height Transparent colors for overlays RGB(89,140,255) RGB(41,117,41) RGB(23,23,23) RGB(0,0,0) src_img_width src_lat_min src_lon_max src_margin_bottom
DataCube DataGranule DataSeries Dimension Z Dimension Y Dimension X Hierarchy of Data Objects:DataGranule, Data Series, DataCube Measure A measure (in OLAP terminology) represent numerical values for a specific entity to be analyzed (e.g. temperature, wind speed, pollutant). A collection of measures form a special dimension ‘ Measures’ (??Can Measures be Dimensions??) Data Granules A data granules– discrete, atomic data entities that cannot be further broken down. A data series is an ordered collection of data granules DataSeries is a collection of DataGranules having common attributes All data points in a measure represent the same measured parameter e.g. temperature. Hence, they share the same units and dimensionality. The data points of a measure are enclosed in a conceptual multidimensional data cube; each data point occupies a volume (slice or point) in the data cube. Data points in a measure share the same dimensions; Conversely, each data point has to have the dimensional coordinates in the data cube of the measure that it belongs to.
DataCube DataGranule 3D 1D Dimension Z Data Array Dimension Y 2D Dimension X
Data Space for a Measure Data Views Measure Data Space View Data Space Data Ymax Zmax Ymax Zmin Ymin Z Data Granule Xmin Xmax Zmin Zmin Ymin Y Xmin Xmax X DVoy Data Space • aergqegqet
Geo-referenced Map Image: Time IndexedRegular Time Series; Fixed Georect; Image Trim Virtual Tables (No physical StarTables) XML Example: TOMS <measure code="TOMS01" name="TOMS - Aerosol Index - Glob" descr="Earth probe TOMS aerosol index"> <data_source service_url="http://capita.wustl.edu/dataservice/data.asmx"/> <data_facts> < fact_attributes > <data name ="TOMS" type="map image" descript="/> <granul_query handler_assembly= (access handler)…./> <image width=“640" height=“480“ margin_left="69" margin_top="46"/> < georect lat_ min="-65" lat_ max="65“ lon_min="-180“ lon_max="180“ unit ="DecDeg“ /> </ fact_attributes > </ data_facts> <data_dimensions> <time_dimension handler_assembly="CAPITA.data.index.impl" handler_class="CAPITA.data.index.impl.datetime_interval" start_time="1996-07-25" end_time="yesterday"> sample_periodicity _unit = "day" sample_periodicity_mult = “1" </time_dimension> </data_dimensions> </measure> ftp://jwocky.gsfc.nasa.gov/pub/eptoms/images/aerosol/y2002/ea020510.gif
SQL Table Geo-referenced Map Image: Image IndexedVariable Time , Var GeoRect, Var Sensor XML Example: SeaWiFS <measure code=“SeaWiFS01" name=“SeaWiFS – Reflectance Images - Glob" descr=" SeaWiFS – Reflectance Images - Global"> <data_source service_url="http://capita.wustl.edu/dataservice/data.asmx"/> <data_facts> < fact_attributes > <data name ="SeaWiFS" type="map image" descript=“stuff stuff “/> <granul_query handler_assembly= (access handler)…./> <fact table, SQL same as CIRA > </ fact_attributes > … see table left </ data_facts> </measure> NO DIMENSION TABLES
SQL Table Astronaut Photos: Image IndexedVariable Time, Image Center, Platform XML Example: ISS004 <measure code=“AstroPhoto01" name=“Astronaut Photographs " descr=" Astronaut Photographs "> <data_source service_url="http://capita.wustl.edu/dataservice/data.asmx" /> <data_facts> < fact_attributes > <data name ="SeaWiFS" type="map image" descript=“stuff stuff “/> <granul_query handler_assembly= (access handler)…./> <fact table, SQL same as CIRA > </ fact_attributes > … see table left </ data_facts> </measure>
SQL Table Atmospheric Photos: Image IndexedVariable Time, Image Center, Platform XML Example: Dust Plume Photo <measure code=“AtmosPhoto01" name=“Atmospheric Photographs " descr=" Atmospheric Photographs "> <data_source service_url="http://capita.wustl.edu/dataservice/data.asmx" /> <data_facts> < fact_attributes > <data name ="SeaWiFS" type="map image" descript=“stuff stuff “/> <granul_query handler_assembly= (access handler)…./> <fact table, SQL same as CIRA > </ fact_attributes > … see table left </ data_facts> </measure>
Add New Layer (New): Populate DVoyState.xml DVoy Catalog Database DatasetInfo.xml DatasetList.xml DVoyState.xml DVoyState.xml WSGetDatasetList DatasetSelector WSGetDatasetInfo On LoadCatalogPage On AddLayer Init DVoyState Add layer/dataset_abbr to DVoyState Add Layer Description to DVoyState
Dvoy Catalog Interaction: Find -> Bind DVoy Catalog Database DatasetInfo.xml DatasetList.xml DVoyState.xml DVoyState.xml WSGetDatasetList DatasetSelector WSGetDatasetInfo On LoadCatalogPage On AddLayer Init DVoyState Add layer/dataset_abbr to DVoyState Add Layer Description to DVoyState
Dvoy Catalog Interaction: Find -> Bind DVoy Catalog Database On AddLayer Find Bind GetDatasetList GetAccessInfo DataSelectService – performs the FIND web service operation • Queries the catalog for the list of datasets through GetDatasetList service • Passes the returned DatasetList to a controller (listbox) where the user selects a dataset • DataSelectService places selected DataCode into DVoyState.xml DataInfoService – performs the BIND web service operation • Accepts data generic data request: GetAccessInfo (DatasetCode, Dimension, Param, Location, Time, ViewConstr) • retrieves or generates access instructions for the query, places them into DVoyState.xml • DataInfoService exposes the DataSelectService exposes the selected DataCode AccessInfo DatasetList DatasetCode DataSelectService DataInfoService DVoyState.xml CursorCodes User User Selects New Data layer Browsing Environment