Download
1 / 42
420 likes | 541 Views
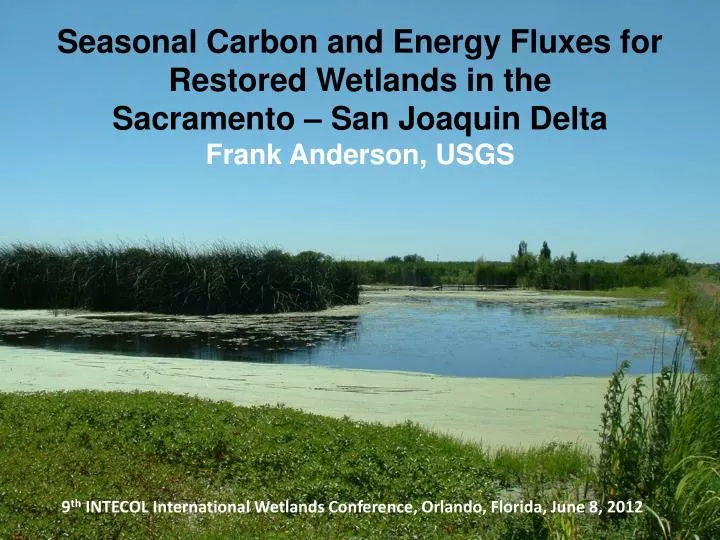
Seasonal Carbon and Energy Fluxes for Restored Wetlands in the Sacramento – San Joaquin Delta Frank Anderson, USGS. 9 th INTECOL International Wetlands Conference, Orlando, Florida, June 8, 2012. Goals. What are the atmospheric conditions that can lead to maximum wetland productivity

E N D
Seasonal Carbon and Energy Fluxes for Restored Wetlands in the Sacramento – San Joaquin Delta Frank Anderson, USGS 9th INTECOL International Wetlands Conference, Orlando, Florida, June 8, 2012
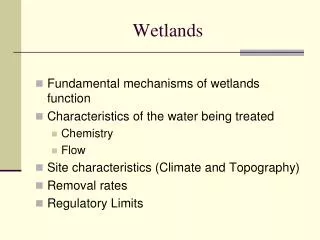
Goals • What are the atmospheric conditions that can lead to maximum wetland productivity • Annual Carbon Budget from a Temperate Wetland • Wetland Annual Variability
Twitchell Island Wetland Met Tower (ET, CO2, CH4)
Radiometers Upward & Downward PAR Sensors Diffuse Radiometer Kipp & Zonen 4-Channel Net Radiometer
Eddy Covariance Instrumentation CSAT3 Sonic Anemometer HMP45C: Relative Humidity Air Temperature LI7500: CO2/H2O Intake for Closed Path LGR CH4 Sensor LI 7700 Open Path CH4 Sensor
Twitchell Island Wetland Met Tower (ET, CO2, CH4) UCB Rice Met Tower (ET, CO2, CH4)
Twitchell Island Wetland Met Tower (ET, CO2, CH4) UCB Rice Met Tower (ET, CO2, CH4) Feed Corn Met Tower (ET)
Twitchell Island Wetland Met Tower (ET, CO2, CH4) UCB Rice Met Tower (ET, CO2, CH4) Maize (grain) Met Tower (ET, CO2) CIMIS Met Tower (Reference ET)
Twitchell Island West pond Met Tower (ET, CO2, CH4) East pond Met Tower (ET, CO2) UCB Rice Met Tower (ET, CO2, CH4) Maize (grain) Met Tower (ET, CO2) CIMIS Met Tower (Reference ET)
Study Site on Twitchell Island Alfalfa Sampling site Flux Towers West pond: 25 cm deep East pond: 55 cm deep Corn
Calculating Eddy Covariance Flux EC Tower
Calculating Eddy Covariance Flux Vertical Wind Component EC Tower
Calculating Eddy Covariance Flux EC Tower
Calculating Eddy Covariance Flux Net Upward Flux w’ = positive s’ = positive w’ = negative s’ = negative
Calculating Eddy Covariance Flux Net Downward Flux w’ = positive s’ = negative w’ = negative s’ = positive
w’T’ w’H2O’ w’CO2’ w’CH4’
Annual Total: -351 g CO2/m2/yr -1.42 MT CO2/acre/yr
To keep Carbon Sequestration rates high, need to • Maintain water levels • Remove or bury thatch (“lodging”) 2010 Vegetation Classification 56% classified as thatch (brown) 34% classified as emergent marsh (green) 2011 Vegetation Classification 16% classified as thatch (brown) 74% classified as emergent marsh (green)
EP 2010/11: 5.11 MT CO2/acre/yr EP 2011/12: -1.29 MT CO2/acre/yr WP 2011/12: -1.42 MT CO2/acre/yr
Fig 1 Fig 2 Continuous NEE (gapfilled 2010, 2000-2 DNDC) NEE (raw data – not gap filled) Fig 3 Fig 4
Concluding Remarks • The Delta’s Mediterranean type climate can provide a long dry growing season with cool nights • Annual variation in the East Pond alternating from a source to a sink • The East Pond had 2 – 4 times higher NEE in it’s earlier stages
Collaborators: Dennis Baldocchi, Matteo Detto, Joe Verfaillie, Jaclyn Hatala, Oliver Sonnentag UC Berkeley Lisamarie Windham-Myers, Kristin Byrd, Brian Bergamaschi, Travis von Dessonneck, Kathleen Keating, Robin Miller, Roger Fujii USGS
Funding Acknowledgements This research is supported by: USGS Climate Change Program, California’s DWR Levee Program, and the USGS Cooperative Research Program
Freshwater marsh restoration on subsided Delta islands (Peat fills the consistent 25-55cm accomodation space) “Carbon Farm” Lisamarie Windham-Myers, INTECOL, 2012
Constant, large accomodation space Freshwater tidal wetlands accrete peat at average rates of only ~1.5 mm yr-1 (RSLR) Drexler et al. (2009) Wetlands
Why does the Carbon Farm sequester more carbon than other restored wetlands? Leaf structure Stomate size and density Oxidized rhizosphere Typha latifolia Typha latifolila 50 mm Schoenoplectus acutus Schoenoplectus acutus THE PLANTS Moderate GPP w/high vertical LAI Tule: Lignified, aerenchymous, high stomatal density