Download
1 / 37
370 likes | 529 Views
Northern Sacramento Valley Conjunctive Water Management Investigation. The Glenn-Colusa Irrigation District and The Natural Heritage Institute October 21, 2010. Today’s Workshop Objectives. Provide a status report on the investigation progress Listen/Respond to stakeholder questions

E N D
Northern Sacramento Valley Conjunctive Water Management Investigation The Glenn-Colusa Irrigation District and The Natural Heritage Institute October 21, 2010
Today’s Workshop Objectives Provide a status report on the investigation progress Listen/Respond to stakeholder questions Describe next steps to investigation, public meetings, and final report
Motivating Factors - Regulatory and Legislative Changes Significant Values are at Risk: Regional Sustainability Environmental Water supply Economy New Challenges SWRCB Flow Report: 75% unimpaired flow to the Delta November-June DFG Report confirms similar flow needs Delta species (smelt) dominate, salmon at risk Delta Stewardship Council: All Delta all the time Scott Valley/Siskiyou County Groundwater Pumping Lawsuit The Past is the past, How do we control our destiny? Historical operations and uses are constantly changing Local needs and flexibility are now challenged in the Delta context Increasing costs and fees Long term stability and reliability?
Emerging Values What does the region want, what values should be protected? Water supply reliability (surface/groundwater)? Environmental protection/enhancement, both instream and terrestrial? System sustainability, what is it? Others…? What strategies should be pursued to achieve regional goals? Status quo? Regional water investigations and planning? Others…? Just say no…will that do?
Program Objective Examine whether and how operation of groundwater aquifers in the Sacramento Valley could be integrated with operation of existing surface water reservoirs to produce additional firm water supplies Potential benefits: Improved water supply reliability (local, regional, State) Ecosystem restoration (Sacramento and Feather Rivers) Improved Delta inflow per BDCP Increased operational flexibility (CVP, SWP, local) Buffer effects of climate change 6
Program Requirements New net benefits for Sacramento Valley environment and water users CVP and SWP commitments honored(to the extent they presently are) No unmitigated impacts to existing groundwater users Economic feasibility
Initial Site ScreeningWhat Makes for an Attractive Water Banking Site? Groundwater conditions Available aquifer storage space Viable recharge mechanism Productive groundwater wells Suitable GW quality Surface water conditions Surplus flows at times Connection to CVP, SWP or other surface water reservoirs Dual SW and GW use option Impacts/mitigation Isolation from important surface streams Isolation from existing groundwater production wells Ability to mitigate or compensate impacts that cannot be avoided
Typical Sacramento Valley GW Hydrograph (Butte Co.) Early Finding: Traditional water banking generally not viable in the Sacramento Valley due to lack of aquifer storage space.
Re-operate Surface Reservoirs with Groundwater “Backstop” Reservoir re-operation Additional releases to meet program objectives Hope for reservoir refill from surplus surface flows Honor existing CVP and SWP delivery obligations and operations constraints Groundwater operation Pump groundwater to “repay” reservoirs if storage conditions put contract deliveries or temperature control at risk Groundwater used in lieu of surface entitlements that then remain in storage
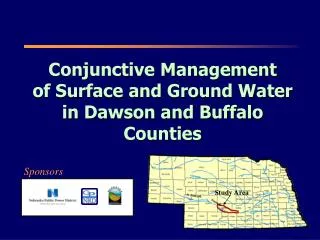
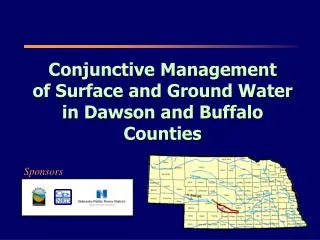
Three Sites Identified Glenn-Colusa ID connected to CVP/Shasta Butte Basin connected to SWP/Oroville Orland Unit connected to Stony Creek Reservoirs
Glenn-Colusa ID connected to CVP/Shasta Two Sites Selected for Modeling Butte Basin connected to SWP/Oroville
Re-operation Conceptual Example Release water from CVP and/or SWP reservoirs to meet project objectives: Unmet local ag demands Regional environmental flow targets If reservoirs refill, no subsequent GW pumping is needed If reservoirs do not refill, pump GW and forego use of surface water in following year as needed for reservoir “payback” New SW supplies can be generated with infrequent additional GW pumping, because reservoirs refill most years
Project Scenarios Defined by Groundwater Pumping Capacity and Season All scenarios modeled with an existing (shallow) and new (deep) well field to reveal range of potential impacts to streams and existing pumpers.
Surface Water Model Results(Example for Scenario 1, Shasta/CVP, 100 TAF Pumping Capacity in GCID) Environmental flow releases Agricultural deliveries Refill from surplus surface water Refill from groundwater pumping
Environmental Flow Objectives Geomorphic Single day large event February or March Riparian establishment Five day large flow with 60 day recession April start Flood plain inundation Single day large event with 45 day recession Between February and April Spring pulse flow Simulate more natural spring runoff period
Scenario 1—CVP/Shasta 100 TAF Pumping Capacity in GCIDEnvironmental Flow Releases
Scenario 1—CVP/Shasta 100 TAF Pumping Capacity in GCIDSac River Agricultural Deliveries
Scenario 1—CVP/Shasta100 TAF Pumping Capacity in GCIDRefill from Surplus Surface Water
Scenario 1—CVP/Shasta100 TAF Pumping Capacity in GCIDRefill from Groundwater Pumping
SW Modeling Summary(Average in years of occurrence 1922-2003, taf)
Project Impacts Due to Additional Groundwater Pumping • Streamflow • Butte Creek in affected area • Other critical streams not in affected areas • Ephemeral streams not analyzed • Groundwater levels and existing wells • Well yield impacts • Incremental pumping costs (due to additional lift)
Butte Creek Impacts Develop baseline flow from available gauging stations Synthesize “with-project” flows based on cumulative reductions in streamflow from changes in stream leakance from GW model
Butte Creek Impacts • No impact in upper reaches (primary spawning and holding areas) • Greatest flow reduction in Jan. – Mar. • During times of highest discharge • Greatest % reduction in summer/early fall • Spring-run have already migrated • Steelhead just beginning to enter stream • Rarely drops below in-stream standards • June during early ‘90s drought • Tradeoffs between Butte Creek impacts and main stem benefits
Impacts to Existing Wells • Used DWR well inventory data • No appreciable impact on irrigation well performance • Increased pumping costs accounted for • Some impact on non-irrigation wells • 9,000 non-irrigation wells in analysis area • Up to ~800 non-irrigation wells in impact zones • Maximum of 25 (0.2%) to 284 (3%) of wells needing deepening or replacement
Groundwater Levels and Impacts to Wells Potential Impact Zones: Worst Case, New Wells Potential Impact Zones: Worst Case, Existing Wells
Incremental Pumping Costs Summary Statistics of Interference Drawdown by Pumping Scenario 10/21/2010 28
Incremental Pumping Costs Summary Statistics of Total Increased Annual Energy Costs to Maintain Existing Groundwater Pumping for Irrigation. (Incremental costs for non-irrigation pumping on the order of $3000 - $5000 per year depending on pumping scenario) 10/21/2010 29
Benefit-Cost Summary 10/21/2010 30
Exploring Operations forAdditional Environmental Benefits • Consultation with CVP and SWP operators • Complying with temperature requirements of greatest concern • Operators provided “unofficial” operations criteria for modeling • Operating for temperature benefit involves tradeoffs with project environmental flow objectives
Temporary Crop Idling to Reduce Payback Cost • Investigated crop idling as an alternative to GW pumping for reservoir payback • Voluntary, incentive driven • Less cost-effective than pumping due to: • High cost: crop idling decisions have to be made early before hydrologic conditions are known • Marginal effectiveness: not all of the avoided water use results in reservoir payback
Principal Findings to Date • SWP and CVP operational requirements are complex and constraining • Must honor all Project commitments and operations rules • Cold water pool management has dominant effect • Cost of payback water is appreciable • Groundwater pumping • Temporary crop idling • Project cost-effectiveness is marginal • Use of Sac groundwater to “backstop” entails mitigation costs • Project water produced in wetter years because it cannot be banked • Modest value of water in Sac Valley
Final Phase 1 Steps Technical Frame existing operational constraints and tradeoffs Formulate and model best performing scenario under existing conditions Analyze impacts and economics Final Report: draft, final Public meetings (between draft and final) Scope Phase 2 of Investigation Continue regional dialogue