Download
1 / 10
100 likes | 167 Views
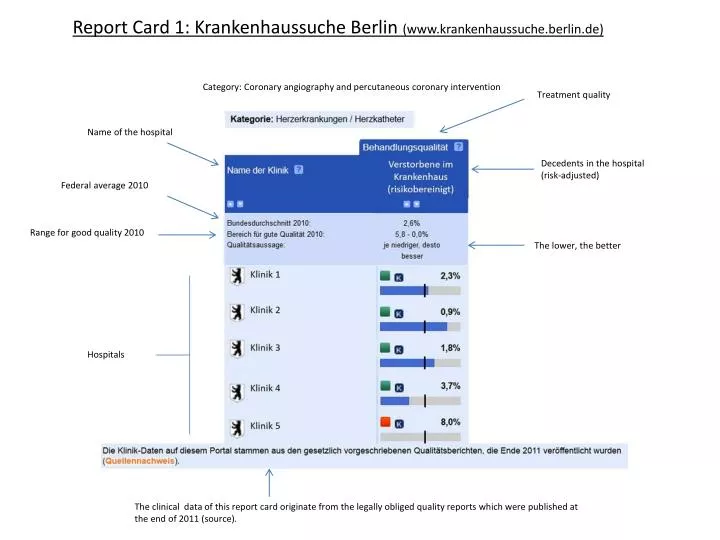
Report Card 1: Krankenhaussuche Berlin (www.krankenhaussuche.berlin.de). Category : Coronary angiography and percutaneous coronary intervention. Treatment quality. Name of the hospital. Decedents in the hospital ( risk-adjusted ). Federal average 2010. Range for good quality 2010.

E N D
Report Card 1: Krankenhaussuche Berlin (www.krankenhaussuche.berlin.de) Category: Coronaryangiographyandpercutaneouscoronaryintervention Treatment quality Name ofthehospital Decedents in thehospital(risk-adjusted) Federal average 2010 Range forgoodquality 2010 The lower, thebetter Hospitals The clinicaldataofthisreportcardoriginatefromthelegallyobligedqualityreportswhichwerepublishedatthe end of 2011 (source).
Report Card 2: Qualitätskliniken.de (www.qualitaetskliniken.de) Quality Coronaryangiography and percutaneouscoronaryintervention (PCI) Ratio oftheobservedtotheexpected rate ofdeaths for all patients in PCI Median Hospital specificvalue Highestvalue Hospitals Unit: O/E
Report Card 3: TK-Klinikführer (www.tk.de/tk/klinikfuehrer/114928) Clinical areas: Coronaryangiography and percutaneouscoronaryintervention On these pages you receive information about treatment results of hospitals. For the first time, hospitals are obliged to publish a part of the collected data of the BQS. The Klinikführer presents quality indicators, which have to be published or which are recommended for publication. Such data is available for medical and nursing results for approximately 1,500 out of 2,000 hospitals. Name ofthequalityindicator Ratio oftheobservedtotheexpected rate (O/E) Hospital result Reference range Federal average Evaluation Hospitals Discrepant Reanalysisnecessary Non-discrepant Other Explanation of the Structured Quality Dialogue process The TK-Klinikführer illustrates this classification in green, yellow and red. If there is no data presented, it can be possible (amongst others) that the Structured Quality Dialogue has not ended yet when the hospital has published its data. In this case, the reported data regarding the outcome is excluded.
Report Card 4: Weisse Liste (www.weisse-liste.de) Resultlists Hospital searching Short explantationabouthowtointerprettherisk-adjustedqualityindicator Everydaylanguagedescriptionoftherisk-adjustedqualityindicator Outcome Evaluation Structured Quality Dialogue Comment competentauthority Comment hospital Hospitals Outcome non-discrepant Outcomediscrepant Assessment incomplete Other Nodataavailable Further informationaboutthequalityindicatorincludingthefederalreferancerange, thesuitability for publiation, and commentsofthe Federal Joint Committee
Report Card 5: BKK Klinikfinder (www.bkk-klinikfinder.de) Information that the published quality indicators on this page enable to measure and evaluate quality. Thereby, quality is not measured directly but rather presented by means of numbers/ratios. This can lead to a result of a hospital which is marked as discrepant, but the result is marked as non-discrepant. Further information is given, that the record of the total number of cases is missing very often. For this reason, a qualitative monitoring of the results is not possible. Colors are used to indicate the computational interpretation of the results. • Clinical areas in detail: • Treatment of breast cancer • Obstetrics • Etc. Ratio oftheobservedtotheexpected rate (O/E) Status and Structured Quality Dialogue Outcome Confidenceintervall Reference range Federal average Numberofcasestreated Numberofcasesrelevant Hospitals The outcomeiswithinthereferencerangeornosentinelevent was documented. The outcomeis outside ofthereferencerange, but betterthanthefederalaverage. The outcomeis outside ofthereferencerange and lowerthanthefederalaverageora sentineleventwas documented. The hospitaloutcomeis not available, theresultisimplausibleorthefederalreferencerangeis not defined.
Report Card 6: Deutsches Krankenhausverzeichnis(www.deutsches-krankenhaus-verzeichnis.de) Result presentationofcomparison Results for selectedqualityindicatorsfromtheprocedure QSKH-RL Clinical areas Coronarangiography and percutaneouscoronaryintervention (PCI) Legend Hospitals Quality indicatoroftheclinicalareacoronaryangiography and percutaneouscoronaryintervention Ratio oftheobservedtotheexpected rate (O/E) Structured Quality Dialogue Outcome Confidenceintervall Federal average Comment hospital Comment authority In casethatthetabledoes not containanyresultforonequalityindicator, itcanbe due tothefact, thatthehospital (e.g. lesscases) was not communicatedtheresultoftheStructured Quality Dialogue. 1) Upon conclusion of the Structured Quality Dialogue, the result is classified as qualitatively non-discrepant. 2) Upon conclusion of the Structured Quality Dialogue, the result is classified as qualitatively non-discrepant. The results will be subject to special monitoring over the further course. 8) The result is classified as non-discrepant. No Structured Quality Dialogue is necessary. 9) Other (explained in the commentary). See Aqua Institut (2012) for a completedescription .
Report Card 7: Hamburger Krankenhausspiegel (www.hamburger-krankenhausspiegel.de) Quality resultsregardingheartcatheterinterventions Quality attribute: lownumber of deaths Goodqualityisconsideredwhen the observed rate of deathsisloweror at the same levelastheexpected rate. The followingtwoillustrationsillustratethemortalityduring a heartcatheterintervention. Expected rate Observed rate Hospitals Further explanations: In Hamburg, themeanobservedmortality rate isequaltotheexpectedmeanmortality rate (2.69 percent). However, themeanmortality rate in Hamburg ishigherthan the observed rate atthefederallevel (2.3 percent). For hospital 4 and 5, theobservedmortality rate ishigherthan the expected rate. Thosecomputational discrepancies could be plausibly explained. Thus, no qualitative discrepancies in the clinical area wereconcluded. Explanation of the meaning “expected rate” and “observed rate”. Information about the risk-adjustment procedure.
Report Card 8: Initiative Qualitätsmedizin (www.initiative-qualitaetsmedizin.de) Observed rate - Numberof patientstreated IQM Average - Numberof patientstreated IQM Target value - Source Expected rate - SMR Quality indicators Hospitals Everyday language description of the quality indicator
Report Card 9: Klinikführer Rheinland (www.klinikfuehrer-rheinland.de) Hereyoucancomparethequalityofselectedhospitals. A trafficlightssystemisusedtoillustrate the classification. The colors mean the following. Green: non-discrepant Yellow: reanalysis will becarried out Red: discrepant Ratio oftheobserved totheexpectedmortality rate by riskprofiles Outcomes should range between 0 and 2.40 (“green“ range) Index Explanation Hospitals Hospital isclassifiedas non-discrepantthisyear; theresultsshouldbemonitoredagainoverthefurtheranalysis. Explanation of theindicator: Explanation of the meaning “expected rate” and “observed rate”. Information about the ratio of both rates.
Report Card 10: Krankenhaus.de (www.krankenhaus.de) Clinical areaswithqualityresults Result Numberofcases relevant Federal average Reference range Ratio oftheobservedtotheexpected rate (O/E) The result is classified as non-discrepant. No Structured Quality Dialogue is necessary. Hospitals Authority noteatthefederal and statelevel: The resultis non-discrepant. No Structured Quality Dialogue isnecessary. The resultisbetterthan the referencevalue and thefederalaverage. The resultis not published, thereferencerangeis not defined, thesentinelevent was documentedorthefederalaverageisunknown The resultisbetterthan the reference value and lowerthanthefederalaverage, or the resultisbetterthanthefederalaverage and lowerthan the reference value. The sentineleventisreportedif the reference value occursveryrarely. The resultislowerthan the reference value and lowerthanthefederalaverage. Information about the definition of quality indicators/referenceranges