Download

1 / 14
200 likes | 442 Views
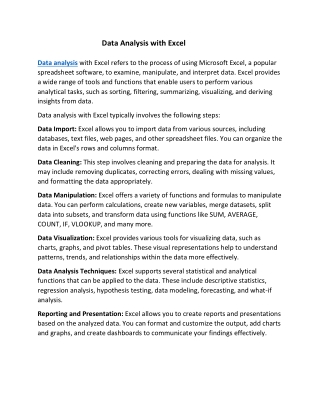
DATA ANALYSIS WITH EXCEL: PIVOT TABLES. Pivot tables in Excel. 1. Select the data range from which you want to make pivot tables. Note! Before proceeding with pivot tables, make sure that there is no empty column, i.e. a column that does not represent any question!. Pivot tables in Excel.

E N D
Pivot tables in Excel 1. Select the data range from which you want to make pivot tables Note! Before proceeding with pivot tables, make sure that there is no empty column, i.e. a column that does not represent any question!
Pivot tables in Excel 2. Go to Insert and choose Pivot table, clickOK
Pivot tables in Excel you arrive to this…
Pivot tables in Excel 3. Make your pivot table – just drag and drop fields into the pivot table grid. In this example I use gender, where “1” stands for males and “2” stands for females.
Pivot tables in Excel If I just want to know how many females and males are in the datasets, I use the respondent ID and drag it into the field Values.
Pivot tables in Excel Then, click on the Value Field Settings …
Pivot tables in Excel …. and choose Count Note: Normally, we are interested in the number of respondents by category and we use Count, but we may also be interested in, for example, averages, maximum etc. and this is the place where we can specify it.
Pivot tables in Excel This is the result – in my dataset, there are 3 females and 4 males.
Pivot tables in Excel If you prefer to have the results in percentages, e.g. you want to know the share of females and the share of men in the sample, go back to the Value Field Settings, choose Count, then click on Show values as… and choose the appropriate %. In my case I want % of column total.
Pivot tables in Excel …and the results are shown below – in my sample there are 57.14% of men and 42.86% of women. Once I am happy with my table, I can proceed to the creation of graphs (see also above).
Pivot tables in Excel – cross-tabulations If we are interested in the cross-tabulations of two variables, i.e. gender the country of living, the pivot tables can be used again. Yet, once I arrive to defining the pivot table, I drag both variables into the appropriate field. In the example below, we want gender to be in rows and the country of living in columns.
Pivot tables in Excel – cross-tabulations ..and the results are below Remember that in case of gender “1” stands for males and “2” stands for females. In case of the country of living “1” stands for Kyrgyz Republic and “2” stands for the Russian Federation. This means that in my sample there are 4 males living in Kyrgyz republic, 2 females living in Kyrgyz republic and 1 female living in the Russian Federation.