Download
1 / 15
150 likes | 277 Views
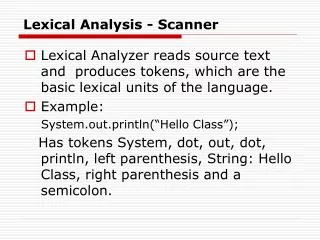
Optimizing Laser Scanner Locations using Viewshed Analysis. MEA 592 Final Project November 20,2009 Jeff Smith. Outline. Project Purpose Laser Scanning Viewshed Analysis Data Methodology Results Discussion Conclusion. Project Purpose.

E N D
Optimizing Laser Scanner Locations using Viewshed Analysis MEA 592 Final Project November 20,2009 Jeff Smith
Outline • Project Purpose • Laser Scanning • Viewshed Analysis • Data • Methodology • Results • Discussion • Conclusion
Project Purpose Determine the minimum number of scanner observation points for complete coverage of desired area. Create a 10cm resolution DEM with the goal of measuring erosion and deposition by scanning the area before and after storms. Saves time in the field if observation points are determined ahead of time.
Laser Scanning • Collects tens of thousands of 3D points (x,y,z) per second. • Creates a point cloud from which a DEM can be derived. • Rotates 360° • Specifications for this project: • Height of Instrument: 1.8m • Range: 150m
Viewshed Analysis • A viewshed is determined by an observer’s line of sight. • If an observer can “see” a point then it is considered to be within it’s viewshed. • For DEMs, viewshed is computed by performing line of sight analysis from the observation point to each cell within a given distance. • Can be used for visual analysis or signal analysis, i.e. cell phone towers
Line of Sight • Calculating Line of Sight • Equation for observation point A and target point B • tanα = (zB-zA)/dBA • If for any point C between A and B, αc > α, then B is not visible. • If for any point C between A and B, αc < α, then B is visible
Data – Derivation of DSM LiDAR points – multiple returns collected each with x,y,z coordinates Extract first return points for use in interpolation Interpolate first return points to create DSM DSM (showing vegetation and other above bare earth features) used in viewshed analysis.
Data • elev_lidrurfirst_1m • 1m resolution raster DSM (interpolated first return LiDAR points) • streets_wake • vector (street centerlines in Wake County) • streams • vector (streams in Wake County) • All data in NC State Plane Coordinates, Units: Meters • Spatial Extent: North 220750m, South 220000m, East 639000m, West 638300m *All data obtained from in-class data
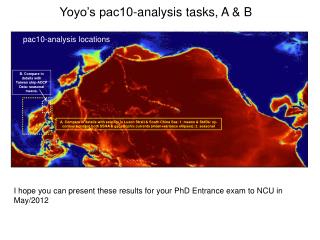
Data Area of Interest
Methodology • Steps for performing viewshed analysis • Determine coordinates for observation point(s) • Observation points were determined by visually choosing points that seemed to be good choices and then adjusted if needed • Get height and range of scanner • Height of Instrument: 1.8m • Range: 150m • Calculate Viewshed • Determine visible cells by line of sight analysis • Derive cumulative viewshed to see overall coverage of scans
ApproachWork Flow Automation • Create text file of proposed coordinates • Run Python Script - ViewScript.py • Creates shell script of GRASS commands • Run shell script in GRASS • Develops viewshed for each set of coordinates and cumulative viewshed • Display raster images
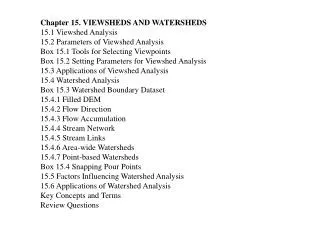
Results 8 viewsheds to reasonably cover area of interest
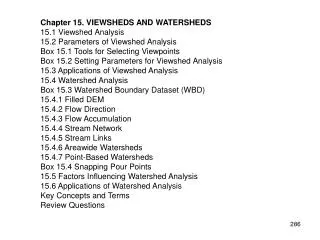
Results Red = Areas of High Multiple Overlap Green = Area of Single Coverage Cumulative View – Shows combined coverage of all viewsheds with varying degrees of overlapping.
Discussion • Most of the open areas are covered with a few small gaps of 1-5m. Could readjust or add observation points to achieve total coverage. • Trees obviously provide the largest problems. • DSM derived from LiDAR data assumes trees are somewhat cylindrical in shape with a constant diameter from top to bottom • Scanner coverage under canopy with minimal low vegetation would probably be better than predicted from viewshed analysis • Future Study: Would like to find way to have the software automatically determine suitable observation points. At this time, visual determination of points seems most efficient.
Conclusion • Process of locating multiple observation points and running viewshed analysis is time consuming when done on an individual point basis. • Task made easier by processing a group of points simultaneously and running analysis through output shell script. • Once settled on suitable observation coordinates we go to the field… • Verify quality of locations in the field • Set georeferenced markers in the ground so the same points can be occupied at later observation times