Download
1 / 42
420 likes | 567 Views
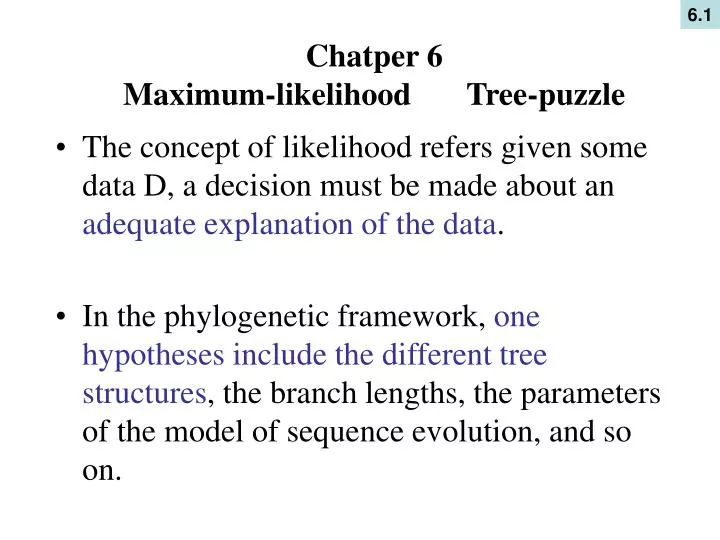
6.1. Chatper 6 Maximum-likelihood Tree-puzzle. The concept of likelihood refers given some data D, a decision must be made about an adequate explanation of the data .

E N D
6.1 Chatper 6 Maximum-likelihood Tree-puzzle • The concept of likelihood refers given some data D, a decision must be made about an adequate explanation of the data. • In the phylogenetic framework, one hypotheses include the different tree structures, the branch lengths, the parameters of the model of sequence evolution, and so on.
N=100h=21t=79 Binominal distribution Likelihood function
For ease of computation, first compute the logarithm of the likelihood function, which results in sums rather than products: • It is known that the maximum of a function y=f(x) – when it exists- is given by the value x for which the first derivative of the function equals zero.
= h/n =h/n ^ ^ θ θ • This derivative is equal to zero if θ=h/n, positive for smaller values of θ, and negative for larger values, so that log [L(θ)] attains its maximum when . Thus is the maximum-likelihood estimate (MLE) of the probability of observing a heads in a single coin toss.
Odds ratio • L(21/100) ~ 0.0975 • L( 1/2 ) ~ 1.61 x 10⁻⁹ : 0.21 vs 0.5 0.0975/ 1.61x 10⁻⁹ ~ 6 x 10⁷ In evolution, point mutations are considered chance events, just like tossing a coin. therefore, at least in principle, the probability of finding a mutation along one branch in a phylogenetic treecan be calculated by using the same maximum-likelihood framework.
The main idea behind phylogeny inference with maximum likelihood is to determine the tree topology, branch lengths, and parameters of the evolutionary model (e.g., transition/ transversion ratio, base frequencies, rate variation among sites) that maximize the probability of observing the sequences at hand. In other words, the likelihood function is the conditional probability of the data given a hypothesis (i.e., a model of substitution with a set of parameters θ and the tree τ, including branch lengths):
6.2 A tree with two taxa has only on branch connecting the two sequences; the sole purpose of the exercise is reconstructing the branch length that produces the data with maximal probability. A B
6.2.1 The simple case: Maximum-likelihood tree for two sequences • The alignment has length l for the two sequences Si = (si(1), …, si ( j )), (i = 1, 2), where si ( j ) is the nucleotide, the amino acid, or any other letter from a finite alphabet at sequence position j in sequence i.
GATCATC……..ATCATAAAATTTACGCA GATACCC……..ATCAATAAATTTACCCA
Identical pairs of nucleotides (l0) and the number of different pairs (l1), where l0 + l1= l. GATCATC……..ATCATAAAATTTACGCA GATACCC……..ATCAATAAATTTACCCA GAACCTC……..AACATAAAATTTAGCCA …..
l j=1 a tree t • First, it is assumed that each site sin the alignment evolves according to the same model M. • The assumption also implies that all sites evolve at the same rate μ. • The rate at a site is modified by a rate-specific factor, ρj>0. …..The probability of a certain site pattern are available. • Pr [Ds, τ, M, ρj], j =1, …l(6.11) L (τ, M, ρ) = Pr[D, τ, M, ρ]=P Pr[D, τ, M, ρ] j j (6.12) D=(D1, D2, D3, …, Dl)
First, for a fixed choice of τ, M, and the site rate vector ρ, the probability to observe the alignment D can be computed with Equation 6.11. • Second, for a given alignment D, Equation 6.12 can be used to find the MLEs. • It is assumed that the site-specific rate factor ρj is drawn from a Г- distribution with expectation 1 and variance 1/α.
6.3 • Consider the tree τ with its branch lengths (i.e., number of substitutions), the model of sequence evolutionM with its parameters (e.g., transition/ transversion ratio, stationary base composition), and the site-specific rate factor ρj = 1 for each site j. The goal is to compute the probability of observing one of the 4n possible patterns in an alignment of n sequences.
s1 s3 d1 d3 d5 s6 s5 d4 d2 s2 s4
It is assumed that evolution started from sequence S0and then proceeded along the branches of tree τ with branch lengths d1, d2, d3, d4, and d5. To compute Pr [Dj, t, M, 1] for a specific site j, where Dj = (s1, s2, s3, s4) are the nucleotides observed, it is necessary to know the ancestral states s0 and s5. The conditional probability of the data given the ancestral states then will be as follows:
However, in almost any realistic situation, the ancestral sequences are not available. Therefore, one sums over all possible combinations of ancestral states of nucleotides. • The sum can be efficiently assessed by evaluating the likelihoods moving from the end nodes of the tree to the root. In each step, two nodes from the tree are removed and replaced by a single node.
6.3.1 • To generalize this equation for more than four sequences, it is necessary to sum all the possible assignments of nucleotides at the n - 2 inner nodes of the tree. • Let Dj= (s1, s2, s3,…, sn ) be a pattern at a site j , with tree τ and a model Mfixed. Nucleotides at inner nodes of the tree are abbreviated as xi, i = n + 1, …, 2n – 2.
6.3.1 • For an inner node i with offspring o1 and o2, the vector Lij = (Lij = (A), Lij = (C) Lij = (G) Lij = (T)) is defined recursively as where d01 and d02 are the number of substitutions connecting nodei and its descendants in the tree
It is assumed that the node 2n – 2 has three offspring: o1 and o2, and o3, respectively.
s1 s3 d1 d3 d5 s6 s5 d4 d2 s2 s4
6.4 • Finding those branch lengths for tree τ maximizing the log-likelihood function. • When computing the maximum-likelihood tree, the model parameters and branch lengths have to be computed for each tree, and then the tree that yields the highest likelihood has to be selected. Because of the numerous tree topologies, testing all possible trees is impossible.
6.4 • Thus, various heuristics are used to suggest reasonable trees, including stepwise addition (e.g., used in Felsenstein’s PHYLIP package: program DNAML. exe) and star decomposition MOLPHY, as well as the neighbor-joining (NJ) algorithm.
6.4.1 • Given a set of n aligned nucleotide sequences, any group of four of them is called a quartet. The quartet–puzzling algorithm analyzes all possible quartets in a data set.
6.4.1 n 4 n! 4!(n-4)! • In essence, the algorithm is a three–step procedure. The first step, the so-called maximum-likelihood step computes for each of the ( ) = possible quartets the maximum-likelihood values L1, L2, and L3for the three possible four-sequence trees T1,T2, T3.
n ( ) 4 • The resulting list of 3 · likelihoods is then used in the quartet-puzzle step to compute an intermediate tree by inserting sequences sequentially in an already reconstructed subtree.
eventually, sequence E is inserted at the branch with minimal penalty. • For large data it is not feasible to compute all intermediate trees. Thus the quartet-puzzle step is repeated at least a thousand times for various input orders of sequences to avoid reconstruction artifacts due to the ordering of the sequences and to get a representative collection of trees.
Finally, in step three, the majority -rule consensus is computed from the resulting intermediate trees. The resulting tree is called the quartet-puzzling tree. The consensus step provides information about the number of times a particular grouping occurred in the intermediate trees. This so-called reliability value, or support value, measures (in %) how frequently a group of sequences occurs among all intermediate trees.
6.5 • The accepted strategy is to infer a “reasonable” tree topology with faster–reconstruction methods and use that tree to estimate the parameters. Eventually, a maximum likelihood tree can be re-estimated with the new set of parameters. This approach assumes that parameter estimates are not greatly disturbed when using a slightly incorrect topology. Among the fast distance-based tree reconstruction methods, NJ. It has been shown that the NJ tree is always similar to the true tree.
Based on reasonable pairwise “genetic distance, estimates” an NJ tree is computed. • Then, maximum-likelihood branch lengths are computed for this tree topology and parameters of the sequence evolution are estimates. • Based on these estimates, a new NJ tree is computed and Step 2 is repeated. Step (2) and (3) are repeated until the estimates of the model parameters are stable. TREE-PUZZLE employs this idea to obtain approximate estimates of model parameters, saving computation time and still serving as an efficient tool to estimate model parameters.
6.6 • Approach also may be used to study the amount of evolutionary information contained in a data set. • If L1, L2, and L3 are the likelihoods of trees T1, T2, and T3, then it is possible to compute the posterior probabilities of each tree Ti as pi=Li/(L1 +L2 +L3), where the pi terms sum to 1 and 0 < pi <1 for each i. The probabilities p1, p2, and p3 can be reported simultaneously as a point P lying inside an equilateral triangle, each corner of the triangle representing one of the three possible tree topologies.
If P is close to one corner – for example, the corner T1 – the tree T1 receives the highest support. In a maximum-likelihood analysis, the tree Ti, which satisfies pi = max{p1, p2, p3}, is selected as the MLE. However, this decision is questionable if P is close to the center of the triangle. A more realistic representation of the data is a star-like tree rather than an artificially strictly bifurcating tree.
Therefore, the likelihood-mapping method partitions the area of the equilateral triangle into seven regions. The three trapezoids at the equilateral triangle into seven regions. • The three trapezoids at the corners represent the areas supporting strictly bifurcating trees. • The three rectangles on the sides represent regions where the decision between two trees is not obvious. • The center of the triangle represents sets of P vectors where all three trees are poorly supported. • The three likelihoods for the three tree topologies of each possible quartet are reported as a dot in an equilateral triangle like the one.
The distribution of dots in the seven major areas of the triangle gives an overall impression of the tree-likeness of the data. • That is informative about the mode of evolution of the sequences under investigation is the percentage of dots belonging to the three main different areas in the equilateral triangle. • The three corners represent fully resolved tree topologies. The presence of tree-like phylogenetic signal in the data. The center is the area of star-like phylogeny. • The three areas on the sides represent network-like phylogeny, in which the data support conflicting tree topologies.