Download
1 / 13
130 likes | 199 Views
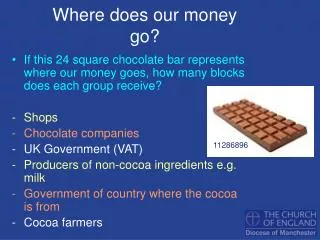
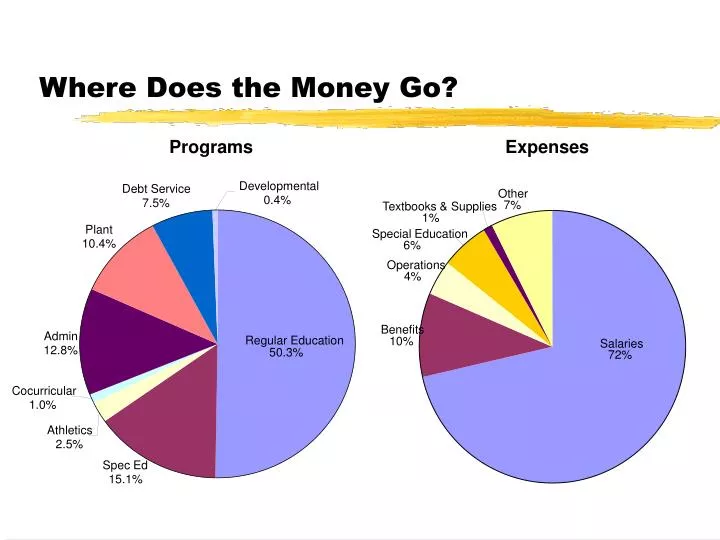
Developmental. Debt Service. Other. 0.4%. 7%. 7.5%. Textbooks & Supplies. 1%. Plant. Special Education. 6%. 10.4%. Operations. 4%. Benefits. Admin. 10%. Regular Education. Salaries. 12.8%. 72%. 50.3%. Cocurricular. 1.0%. Athletics. 2.5%. Spec Ed. 15.1%.

E N D
Developmental Debt Service Other 0.4% 7% 7.5% Textbooks & Supplies 1% Plant Special Education 6% 10.4% Operations 4% Benefits Admin 10% Regular Education Salaries 12.8% 72% 50.3% Cocurricular 1.0% Athletics 2.5% Spec Ed 15.1% Where Does the Money Go? Programs Expenses
Per Pupil Costs, $ 305 264 1167 398 1104 1105 1198 1129 1022 1353 Total Per Pupil Costs 1432 1263 Haddonfield $9,257 K-12 Our Size $9,781 K-12 Our Size / Our DFG $10,308 (District Factor Group) Extracurricular Operations & Maintenance 6249 5908 Administration 5441 Support Services Classroom Instruction K-12 Our Size Haddonfield K-12 Our Size & DFG How Do We Compare in Spending to Other Districts Our Size in New Jersey? Data from 2003 Comparative Spending Guide http://www.state.nj.us/njded/guide/2003/
How Do We Compare in Number of Teachers & Administrators? DFG: District Factor Group I - Socioeconomic Grouping Our Size: K-12 District with 1801 to 3500 students Data from 2003 Comparative Spending Guide http://www.state.nj.us/njded/guide/2003/
Resident Enrollment is Increasing And Tuition Income is Decreasing
0.48% Benefits 0.45% Operations 0.29% Special Education 0.01% Textbooks & Supplies 0.32% Other 4.69% Salaries A “Status Quo” Budget Would Force a 7% School Tax Increase • Current programs are maintained and no new programs are added. • Expense increase is driven by Salaries and Benefits - 80% of our budget. • Tax Increase is higher than expenses (7% v 6.2%) due to lower revenues: • Flat State Aid • Lower Interest Income • Lower Tuition Income • “Status Quo” Is Not Proposed General Expense Increase Totaling 6.24%
Proposed Budget - 5.47% School Tax Increase How Did We Get There? • Reductions to Tax Base Totaling $493,000 • General Expense Cuts $248,000 • New Revenues $145,000 • Reduced Salary Costs through Severance Package $100,000 • New “Initiatives” (Additions to Tax Base) $273,000 • Two Budget Questions
General Expense Cuts - $248,000 • High School Business Teacher $50,000 • Keyboarding and Accounting • Elementary Spanish $50,000 • No World Language in Elementary Schools • Developmental Kindergarten $25,000 • No DK Program (low enrollment) • Kindergarten and Local Preschools to fill gap • 10% Cut in Supplies Budget $50,000 • Postpone purchases • Reading Recovery Training $43,000 • Reading Recovery Program remains unchanged • CST Secretary $30,000
New Revenues - $145,000 • Middle School Tuition Program $100,000 • ~154 students in 7th grade next year. Adding 12 tuition students would yield average class size of 20 to 21. • ~173 students in 8th grade next year. Adding 5 tuition students would yield average class size of 22 to 23. • Middle School Activity Fee $15,000 • $50/yr and $75/year family cap • High School Activity Fee $30,000 • $100/yr and $150/year family cap
New Initiatives - $273,000 • K-12 Curriculum Coordinator (English, SS, World Language) $50,000 • Expansion of previous K-8 Language Arts Supervisor • 3 High School Facilitator positions eliminated • 0.5 English teacher to full time to address class size • Elementary Class Size Reduction (3 Elementary Teachers) $150,000 • Two - 1st Grade Teachers (class size below 20) • 5th Grade Teacher (class size below 27) • Middle School World Language Teacher Increased Hours $20,000 • Reduction in French class size from 34 students • Custodial Services $33,000 • Support for New Square Footage • Nursing Services $20,000 • Support for Central/Middle School Nurse
2nd Question - What is it? • State has established a formula to calculate the maximum General Fund expense increase allowed in the budget question on the ballot. This is called the “cap”. • Any funds budgeted above the cap have to be put into additional question(s). • Our cap for this year equates to a 4.06% school tax increase. • We are recommending spending $336,000 above the cap. Therefore, we have a second question.
Proposed Budget - 5.47% School Tax Increase • Proposed Budget: $23,469,217 versus $22,184,984 in 2002. • Average Assessment of $220,000: • School Tax Increases from $4,856.57 to $5,122.18 • ~$22/month increase • Rule of thumb: $10/month increase for every $100,000 assessed
How does the BOE view two questions? • Not two budgets • Not one budget and a wish list • Is one budget separated only by law!