Download
1 / 11
110 likes | 114 Views
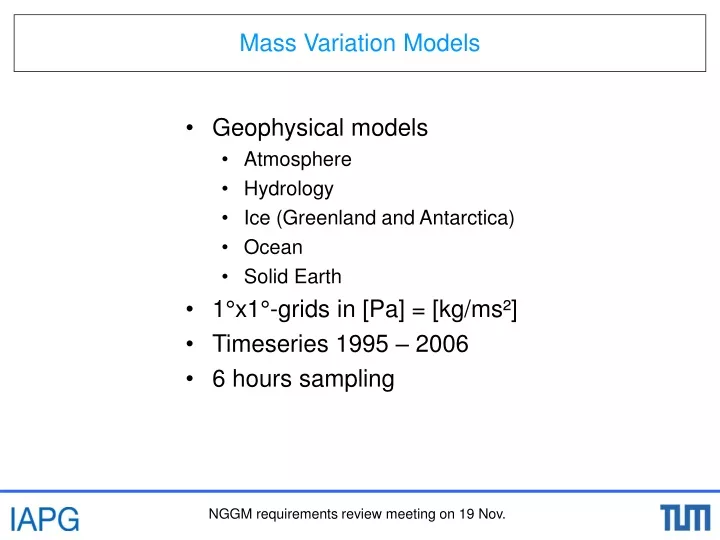
Geophysical models Atmosphere Hydrology Ice (Greenland and Antarctica) Ocean Solid Earth 1°x1°-grids in [Pa] = [kg/ms²] Timeseries 1995 – 2006 6 hours sampling. Mass Variation Models. Global Mean. In total: 263.6 Pa/year. Ocean: +11.9 Pa/year. Atmosphere: +1.4 Pa/year.

E N D
Geophysical models Atmosphere Hydrology Ice (Greenland and Antarctica) Ocean Solid Earth 1°x1°-grids in [Pa] = [kg/ms²] Timeseries 1995 – 2006 6 hours sampling Mass Variation Models
Global Mean In total: 263.6 Pa/year Ocean: +11.9 Pa/year Atmosphere: +1.4 Pa/year Hydrology: +248 Pa/year Ice Antarctica: -1.3 Pa/year Ice Greenland: +3.6 Pa/year
Cut of the first and last years Statistical analyses for every grid point (mean, std, trend, fft,…) Criterions for threshold analysis (absolute values, without Greenland) Global mean (jumps, trend) Hydrology
Hydrology – Mean and Standard Deviation Unrealistic trends in terrestrial water storage Outliers in several lakes (e.g. Caspian Sea, Lake Titicaca)
Hydrology – Trends (1) Greatest variations and trends in inland lakes and Greenland
Hydrology – FFT Regions with high periodic signals should stay in the fields
Hydrology – Global Mean More realistic trends without jumps in global mean values Greenland (mean trend of 3411 Pa/yr)
Reprocessing Hydrology: 1996 – 2005, cut all points with a linear trend greater than 1e4 Pa/yr and cut Greenland Other data sets: reprocessing if necessary (unrealistic trend in ice masses of Greenland) Update of Time-variable spherical harmonic coefficients Mass Variation Models - Proposal