Download
1 / 2
20 likes | 33 Views
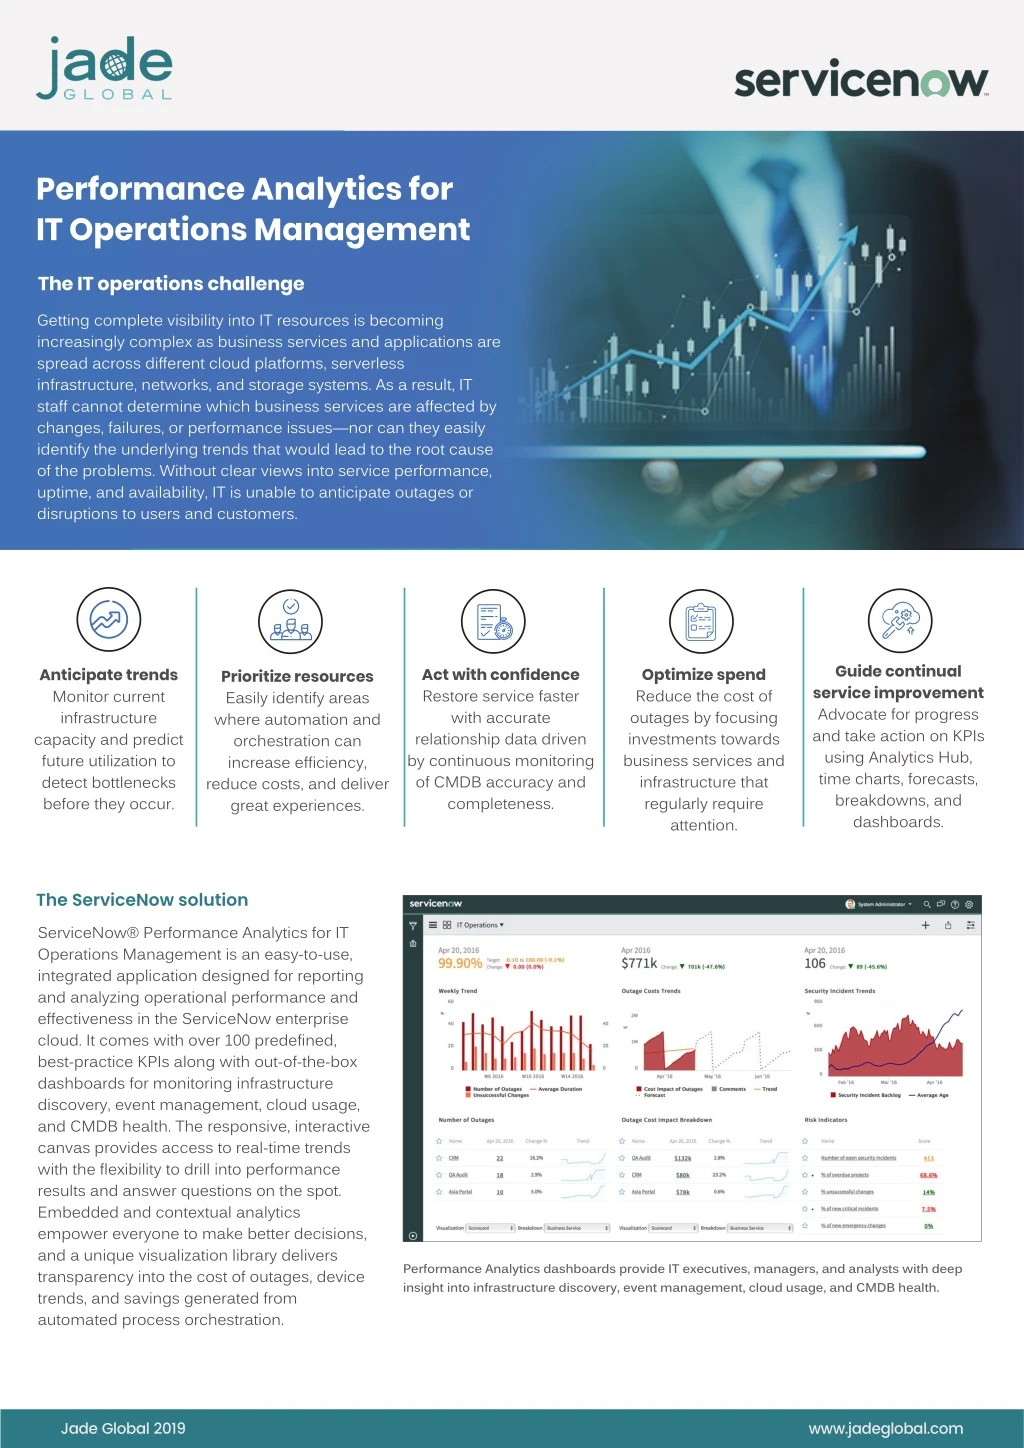
ServiceNowu00ae Performance Analytics for IT Operations Management is an easy-to-use, integrated application designed for reporting and analyzing operational performance and effectiveness in the ServiceNow enterprise cloud.

E N D
Performance Analytics for IT Operations Management The IT operations challenge Getting complete visibility into IT resources is becoming increasingly complex as business services and applications are spread across different cloud platforms, serverless infrastructure, networks, and storage systems. As a result, IT staff cannot determine which business services are affected by changes, failures, or performance issues—nor can they easily identify the underlying trends that would lead to the root cause of the problems. Without clear views into service performance, uptime, and availability, IT is unable to anticipate outages or disruptions to users and customers. Guide continual service improvement Advocate for progress and take action on KPIs using Analytics Hub, time charts, forecasts, breakdowns, and dashboards. Act with confidence Restore service faster with accurate relationship data driven by continuous monitoring of CMDB accuracy and completeness. Optimize spend Reduce the cost of outages by focusing investments towards business services and infrastructure that regularly require attention. Anticipate trends Monitor current infrastructure capacity and predict future utilization to detect bottlenecks before they occur. Prioritize resources Easily identify areas where automation and orchestration can increase efficiency, reduce costs, and deliver great experiences. The ServiceNow solution ServiceNow® Performance Analytics for IT Operations Management is an easy-to-use, integrated application designed for reporting and analyzing operational performance and effectiveness in the ServiceNow enterprise cloud. It comes with over 100 predefined, best-practice KPIs along with out-of-the-box dashboards for monitoring infrastructure discovery, event management, cloud usage, and CMDB health. The responsive, interactive canvas provides access to real-time trends with the flexibility to drill into performance results and answer questions on the spot. Embedded and contextual analytics empower everyone to make better decisions, and a unique visualization library delivers transparency into the cost of outages, device trends, and savings generated from automated process orchestration. Performance Analytics dashboards provide IT executives, managers, and analysts with deep insight into infrastructure discovery, event management, cloud usage, and CMDB health. Jade Global 2019 www.jadeglobal.com
Embedded, Contextual Analytics Extensible Library of KPIs and Dashboards Performance Analytics includes powerful, in-platform analytics for ServiceNow IT Operations Management. This empowers employees with self-service intelligence based on secure, realtime data—while retaining the business context needed to turn insights into action. Embedded analytics provide faster, more secure, and more reliable results than traditional business intelligence, or third-party tools, and make data discovery more accessible to stakeholders at all levels of the business. Using in-form analytics, IT operations managers and analysts can access context-sensitive trend data instantly and use that knowledge to optimize spending decisions, reassign resources to business priorities, anticipate utilization bottlenecks, and drive the business forward. In-platform analytics also facilitates compatibility with any changes or customizations across the ServiceNow platform, making upgrades a seamless experience while delivering fast time-tovalue for users across the enterprise. KPIs are quantifiable values that enable companies to measure how effectively they are progressing toward key business objectives. In IT Operations Management, KPIs might include metrics such as the daily uptime of business services, overall usage of cloud services, the number of newly discovered devices, and the accuracy ratio of the CMDB. Performance Analytics for IT Operations Management provides out- of-the-box dashboards and 100+ KPIs based on best practices and our service industry experience. Analytics Hub Organizational objectives and metrics (KPIs) are automatically tracked in Analytics Hub, an immersive studio for analyzing, comparing, and predicting progress toward defined targets. For example, if a company is tracking toward a goal of reducing the cost of outages, they may choose to measure: • % of total impacted services • % business services uptime of today • % configuration items ownership • % monitored configuration items Performance Analytics automatically provides a detailed view of each KPI’s performance trend using both current and historical performance data. Through Analytics Hub, IT operations managers and analysts can track KPIs and breakdowns in real-time while comparing performance against targets. KPIs can also be accessed using mobile devices to check the latest results and analyze their trends anytime, anywhere. Workbench widgets provide end-to-end transparency into KPI trends, breakdowns, and influencing factors. Responsive, Interactive Dashboards Dashboards provide a graphical view of performance trends and realtime results, allowing executives and managers to make quick, informed decisions at a glance. Performance Analytics delivers flexible and interactive dashboards for clear performance visualization and easy customization. Navigation is intuitive and familiar, with dashboards accessed from within the ServiceNow interface using drop-down menus, and tabs. From a dashboard, IT operations managers and analysts can access Analytics Hub, drill into breakdowns, and directly access the underlying operational records. Interactive analysis and filters guide users towards meaningful patterns and trends. Dashboards can be shared with groups or individuals, ensuring there is a single version of truth driving operational improvement. Analytics Hub enables stakeholders to make quick decisions based on emerging and forecasted trends. Jade Global provides enterprise business application implementations, integrations, software product engineering, Cloud services, technology advisory, testing, and managed services across diverse industries. We are headquartered in San Jose, California with U.S. offices in Philadelphia and Los Angeles. Jade Global is an Oracle Platinum Cloud Select partner, Salesforce Silver Partner, ServiceNow Silver partner, Dell Boomi Certified System Integrator Partner and Microsoft Gold partner. We have additional strategic partnerships with NetSuite and Zuora. Jade has been recognized as one of the fastest-growing companies in North America by Inc. 5000 and was featured on the Fastest Growing Private Companies list in the Silicon Valley Business Journal. Jade Global 2019 www.jadeglobal.com