Download
1 / 37
370 likes | 902 Views
Sensory Experience and Cortical Plasticity Michael P. Kilgard University of Texas at Dallas Environmental Enrichment Red Group Enriched Blue Enriched 20 ± 10 vs. 75±20 μ V 81±19 vs. 37±20 μ V 22 rats total A1 Enrichment Effects - after 2 months Enriched Standard

E N D
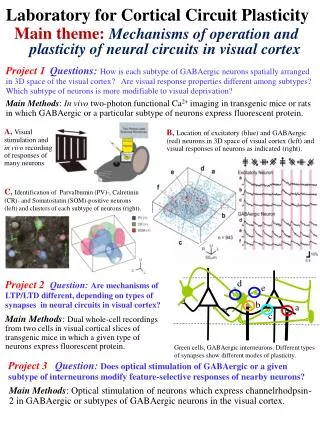
Sensory Experience and Cortical Plasticity Michael P. Kilgard University of Texas at Dallas
Environmental Enrichment RedGroup Enriched Blue Enriched 20±10 vs. 75±20μV81±19 vs. 37±20 μV 22 rats total
A1 Enrichment Effects - after 2 months Enriched Standard • 40% increase in response strength • 1.4 vs. 1.0 spikes per noise burst (p< 0.0001) • 10% decrease in frequency bandwidth • 2.0 vs. 2.2 octaves at 40dB above threshold (p< 0.05) • Three decibel decrease in threshold • 17 vs. 20 dB ms (p< 0.001) Stronger, More Selective, and More Sensitive Environmental Enrichment Improves Response Strength, Threshold, Selectivity, and Latency of Auditory Cortex Neurons Engineer ND, Percaccio CR, Pandya PK, Moucha R, Rathbun DL, Kilgard MP. Journal of Neurophysiology, 2004. N = 16 rats, 820 sites
High Low Cochlea Cortex
High Low Cochlea Cortex Cortical Map Plasticity
Best Frequency Nucleus Basalis Activity Enables Cortical Map Reorganization M.P. Kilgard, M.M. Merzenich, Science 279(5357): 1714-1718, 1998. download file
Tone Frequency - kHz Nucleus Basalis Stimulation Generates Frequency-Specific Map Plasticity N = 20 rats; 1,060 A1 sites
Differences between A1 and Posterior Auditory Field – submitted
Plasticity in Posterior Auditory Field • High frequency map expansion , p<0.01 • Decreased bandwidth (30 dB above threshold) • 3.0 vs. 3.6 octaves, p<0.001 • Shorter time to peak • 56 vs. 73 ms, p<.01 N = 12 rats; 396 PAF sites Manuscript in preparation
Typical Response of A1 Neurons to Tone Trains Temporal Processing
Plasticity of Temporal Information Processing in the Primary Auditory Cortex M.P. Kilgard, M.M. Merzenich Nature Neuroscience 1(8): 727-731, 1998 download file N = 15 rats, 720 sites
Frequency Bandwidth Plasticity N = 52 rats; 2,616 sites Stimulus Paired with NB Activation Determines Degree and Direction of Receptive Field Plasticity
15% 50 % 100% Tone Probability 0 5 10 15 Modulation Rate (pps) Frequency Bandwidth is Shaped by Spatial and Temporal Stimulus Features Temporal Modulation Leads to Larger RF’s Spatial Variability Leads to Smaller RF’s Sensory Input Directs Spatial and Temporal Plasticity in Primary Auditory Cortex M.P. Kilgard, P.K. Pandya, J.L. Vazquez, Gehi, A., C.E. Schreiner, M.M. Merzenich Journal of Neurophysiology, 86: 339-353, 2001. download file
How do neural networks learn to represent complex sounds? High Tone (12 kHz) Low Tone (5 kHz) Noise Burst 100ms 20ms • Spectrotemporal Sequences
Paired w/ NB stimulation High Tone (12 kHz) Low Tone (5 kHz) Noise Burst 100ms 20ms } Unpaired background sounds
Context-Dependent Facilitation High Tone (12 kHz) Low Tone (5 kHz) Noise Burst 100ms 20ms 0 100 200 300 400ms Number of Spikes
Context-Dependent Facilitation - Group Data • 58% of sites respond with more spikes to the noise when preceded by the high and low tones, compared to 35% in naïve animals. (p< 0.01) Noise Burst Order Sensitive Plasticity in Adult Primary Auditory Cortex M.P. Kilgard, M.M. Merzenich Proceedings of the National Academy of Sciences 99: 3205-3209, 2002. download file High Tone (12 kHz) Low Tone (5 kHz) Noise Burst N = 13 rats, 261 sites Schematic Illustration 100ms 20ms
High Tone (12 kHz) Low Tone (5 kHz) Noise Burst 100ms 20ms Context-Dependent Facilitation - Group Data • 25% of sites respond with more spikes to the low tone when preceded by the high tone, compared to 5% of sites in naïve animals. (p< 0.005) Low Tone (5 kHz) Order Sensitive Plasticity in Adult Primary Auditory Cortex M.P. Kilgard, M.M. Merzenich Proceedings of the National Academy of Sciences 99: 3205-3209, 2002. download file N = 13 rats, 261 sites Schematic Illustration
Context-Dependent Facilitation - Group Data • 10% of sites respond with more spikes to the high tone when preceded by the low tone, compared to 13% of sites in naïve animals. High Tone (12 kHz) Order Sensitive Plasticity in Adult Primary Auditory Cortex M.P. Kilgard, M.M. Merzenich Proceedings of the National Academy of Sciences 99: 3205-3209, 2002. download file High Tone (12 kHz) Low Tone (5 kHz) Noise Burst N = 13 rats, 261 sites Schematic Illustration 100ms 20ms
Add first distractor (CS-1) Add second distractor (CS-2) Add third distractor (CS-3) Target stimulus (CS+) Task None None None A) Sequence detection H L N None None B) Frequency discrimination L L L H H H C) Triplet distractor- High first Map Auditory Cortex Frequency (kHz) H L N H H H L L L N N N D) Sequence element discrimination L N H L N H E) Triplet distractor- Noise first H L N N N N L L L H H H None None F) Reverse Order N L H H L N Time (ms) Time (months) Operant Training
kHz ‘SASH’ Group - Spectrotemporal discharge patterns of A1 neurons to ‘sash’ vocalization (n= 5 rats)
16kHz @50dB: 35 % 1.9 55 % 5.3 (p<0.0005)
Sensory Experience Controls: • Response Strength • Cortical Topography • Receptive Field Size • Maximum Following Rate • Synchronization • Spectrotemporal Selectivity
Activity from a single A1 neuron recorded in an awake rat in response to normal and enhanced human speech sounds
External World -Sensory Input Neural Activity - Internal Representation Behavioral Relevance Plasticity Rules - Educated Guess Neural Plasticity - Learning and Memory Behavioral Change
Acknowledgements: Training Experiments - Navzer Engineer Amanda Puckett Crystal Novitski Enrichment Experiments - Navzer Engineer Cherie Percaccio Receptive Field Plasticity - Pritesh Pandya Synchrony Experiments - Jessica VazquezFM Experiments - Raluca Moucha Speech Experiments - Pritesh Pandya and and National Institute for Deafness and Other Communicative Disorders