Download
1 / 25
250 likes | 449 Views
Simulations of Electron Transport Experiments for Fast Ignition using LSP. Presented to: 15 th International Symposium on Heavy Ion Inertial Fusion Princeton University, NJ Richard P. J. Town AX-Division Lawrence Livermore National Laboratory June 7, 2004.

E N D
Simulations of Electron Transport Experiments for Fast Ignition using LSP Presented to: 15th International Symposium on Heavy Ion Inertial Fusion Princeton University, NJ Richard P. J. Town AX-Division Lawrence Livermore National Laboratory June 7, 2004
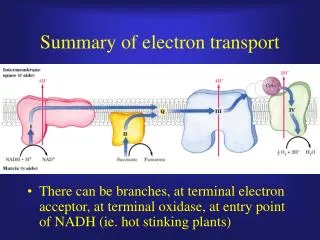
The LSP code has been used to study fast ignition relevant transport experiments • A critical issue for Fast Ignition is understanding the transport of the ignitor electrons to the fuel. • Experiments have shown a rapid increase in beam width followed by reasonable collimation with a 20° half angle. • We have used the LSP code to: • generate simulated K images; • model XUV images; and • model cone focus experiments. • The LSP code has been used to study the effect on beam transport of: • non-Spitzer conductivity; and • the initial beam divergence.
A critical issue for fast ignition is understanding the transport of the ignitor electrons to the fuel Laser couples efficiently to the core Laser couples inefficiently to the core 1026cm-3 1.1x1021cm-3 This is a major driver on the short-pulse laser specification.
The XUV image can be used to estimate the temperature of the rear surface XUV image • A series of LASNEX calculations of isochorically heated Al targets establishes the relationship between temperature and intensity.
CCD camera Bragg crystal mirror Ka fluorescence layer Laser electrons Stephens et al.1 used a Bragg crystal mirror to image a Cu fluor layer embedded in Al with a CCD camera • Fast electron transport is diagnosed by burying a layer of of high-Z (e.g., Cu or Ti) material within a low-Z plasma matrix (e.g., Al or CH). • Electrons reaching the layer cause K-shell ionization and the emitted photons are imaged with a camera, thus characterizing energy transport within a dense plasma. 1R.B. Stephens, et al, to appear in Phys. Rev. E.
Experiments on MeV electron transport have been performed by researchers around the world 250 • Experimental data1 show: • a rapid increase in beam size in the first few microns; and • a fairly collimated (20º half angle) beam in the bulk of the material. 200 X-ray (CH) 150 Spot Radius (m) 100 X-ray (Al) 50 XUV K fluorescence Laser spot 0 200 400 Thickness (m) 1M. H. Key, et al, 5th Workshop on Fast Ignition of Fusion Targets (2001).
LSP1 is a hybrid particle code used extensively in the ion beam community • Performed simulations using 2-D in cylindrical (r-z) geometry. • Employs a “direct implicit” energy conserving electromagnetic algorithm. • Hybrid fluid-kinetic descriptions for electrons with dynamic reallocation. • Scattering between the beam and background plasma included. • Ionization and excitation ignored. • LSP has been coupled to ITS to enable the generation ofKaimages to enable direct comparison with experimental data. • Beam created by injection at the target boundary or by promotion within the plasma. 1D. R. Welch, et al, Nucl. Inst. Meth. Phys. Res. A464, 134 (2001).
R 20μm VACUUM 300μm Al3+ Cu2+ Al3+ 100μm Hot Electron Beam Z 20μm 20μm 20μm We have performed simulations of generic electron transport experiments • The targets are based on the experiments performed by Martinolli et al1 on the LULI and Vulcan laser. • The big uncertainty is the initial hot electron beam parameters. 1E. Martinolli, et al., Laser & Part. Beams 20, 171 (2002).
Typical data from Nova Petawatt laser shows about 30 to 40% of the laser energy in the central spot. We have approximated the laser intensity pattern as two Gaussians. 106 Airy function CCD image of Focal spot 104 Energy density (counts/pixel) 102 100 0.0 40.0 80.0 120.0 Displacement (m) A significant “halo” surrounds the short-pulse high intensity spot
Determining the input electron distribution is based on experimental measurements • The conversion efficiency into hot electrons has been measured by many experimentalists over a wide range of intensities: = 0.000175 I(W/cm2)0.2661
There are two well-known scaling laws for hot electron temperature which we have used • Pondermotive scaling: Thot(MeV)= (Il2/(1019W/cm2mm2))1/2 • Beg scaling: Thot(MeV)= 0.1(Il2/(1017W/cm2mm2))1/3 Pondermotive Beg
The current density and energy distribution can now be defined in terms of laser intensity • Using the new Python front end to LSP the injected beam energy and current density can be calculated from: • conversion efficiency; and • hot temperature scaling law. • A thermal spread is also added. Beg rold = 0.0 for i in range(400): r = (i+0.5)*0.00002 intensity = Gaussian(r, 1.0e-3, 1.0e20, 0.0, 1.0e12) +Gaussian(r, 1.0e-2, 1.0e17, 0.0, 1.0e12) if intensity > 0.0: thot = BegScaling( intensity ) ehot = 1.6022e-16*thot area = pi*(r**2-rold**2) lpower = intensity*area epower = lpower*conversionEfficiency(intensity) Density =1.6022e-19*epower/(area*ehot) rold = r Pondermotive
The LSP code uses Spitzer conductivity, which we know is not valid at low temperatures. • The calculated resistivity of aluminum at solid density increases with temperature. 10-5 Non-Spitzer Spitzer 10-6 Resistivity (m) 10-7 10-8 10-1 100 101 102 103 Temperature (eV)
Reduced filamentation is observed when the conductivity is constant to 100eV • Beam density at 1.6 ps
The Ka diagnostic gives time-integrated images of the emission generated by the hot electron beam • The diagnostic will record both Ka photons generated by the forward going and backward going “refluxed” electrons.
K images were generated at various times throughout the simulations • A time history displaying the birth positions of the K photons can be generated for each source. Photons created 0.5ps 1.5ps 3.0ps Y (mm) Y (mm) Y (mm) R (microns) X (mm) X (mm) X (mm) Base source case: Beg Temperature Scaling, 200keV transverse thermal energy The time integrated diagnostic is a good measure of hot electron beam transport.
LSP calculations show reasonable agreement with experimental data for moderate Al thicknesses • There appears to be moderate agreement in the trend of increasing spot diameter with Al thickness, based on the average between vertical and horizontal line-outs. • The large asymmetry in the horizontal direction is under investigation. LSP calculations Experimental Data Spot Diameter (m) Al Thickness (m)
We can also compare these source scenarios using the K spot diameter at half-max intensity • A significant asymmetry was detected when taking similar line-outs in the horizontal direction, resulting in the relatively large error in spot diameter for many of the data points. 140 120 100 80 60 40 20 0 140 120 100 80 60 40 20 0 Spot Diameter (mm) Spot Diameter (microns) (I2)1/3 (I2)1/2 (I2)3/2 2D Source Injection 0 100 200 300 400 500 600 Thermal transverse temperature (keV)
The LSP calculation matches the measured temperature pattern at the rear surface of the target • 27J of hot electrons, in a 1-ps pulse, with Beg scaling and a thermal spread of 300keV injected into a 100mm Al3+ plasma. • The temperature was obtained by post-processing the LSP energy data at the rear surface with a realistic equation of state.
Z3 is being used to generate hot electrons from LASNEX-predicted pre-pulse plasmas • 1-D line out of plasma formed by 10mJ prepulse on a CH target: • (z,x) plots of electrons with energies > 12 MeV: 0.5 ps 1.0 ps UCRL-PRES-204413-20
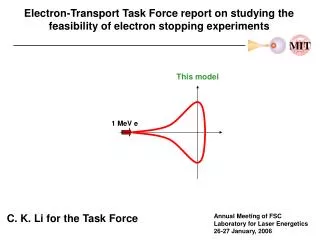
Extracting the correct electron distribution function is more complicated for oblique incidence • A 1019 W/cm2 laser incident on a 16 nc plasma (shown by white lines) at a 30o angle of incidence. • (z,x) phase space plot of electrons with energies > 5 MeV. Electrons injected at a significant angle 0.3 ps 0.6 ps 0.3 ps We are using Python to closely couple Z3 output to LSP input 0.5 ps
Background electron density profile of a gold cone touching a perfect conductor. We have recently started large scale cone calculations using LSP 2MeV electrons promoted along surface
Hot electrons start on inner edge and then diffuse into the cone 0.16 ps 1.4 ps Transport efficiency <20% of hot electron out of cone
The LSP code has been used to study fast ignition relevant transport experiments • A critical issue for Fast Ignition is understanding the transport of the ignitor electrons to the fuel. • Experiments have shown a rapid increase in beam width followed by reasonable collimation with a 20° half angle. • We have used the LSP code to: • generate simulated K images; • model XUV images; and • model cone focus experiments. • The LSP code has been used to study the effect on beam transport of: • non-Spitzer conductivity; and • the initial beam divergence.
Collaborators: • C. Chen, L. A. Cottrill, M. H. Key, W. L. Kruer, A. B. Langdon, B. F. Lasinski, B. C. McCandless, R. A. Snavely, C. H. Still, M. Tabak, S. C. Wilks, LLNL, Livermore, CA, USA. • D. R. Welch, MRC, Albuquerque, NM, USA.